Bitcoin long-term view - bottom after MACD divergence
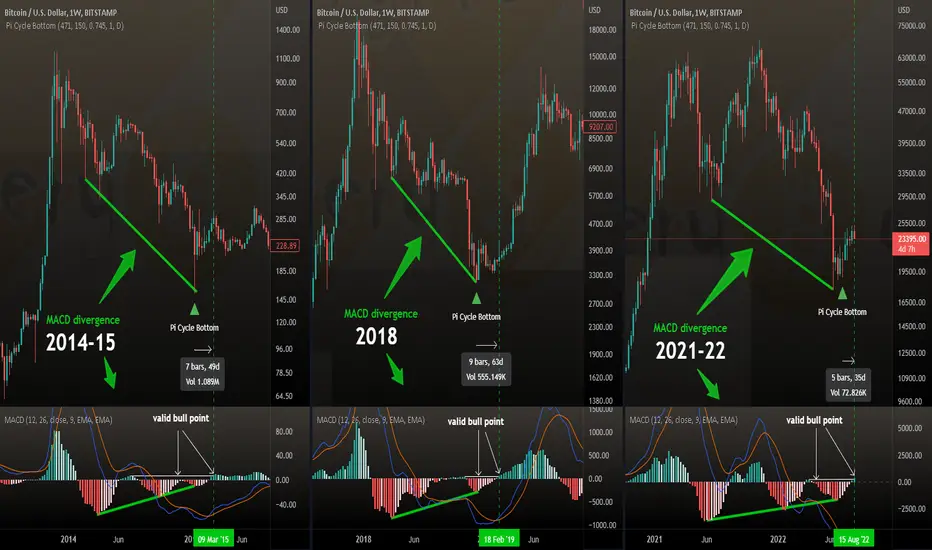
Looking back to 2014-15 and 2018 we had a huge bullish divergence with lower lows on price chart but higher lows in MACD histogram
A further confirmation can be found by a higher high on MACD histrogram after the MACD cross - called valid bull point in the chart
Will history repeat dear Crypto Nation?
*not financial advice
do your own research before investing
The shown ideas are my personal opinion and findings... no financial advice
Please always do your own research before investing
Please always do your own research before investing
Disclaimer
The information and publications are not meant to be, and do not constitute, financial, investment, trading, or other types of advice or recommendations supplied or endorsed by TradingView. Read more in the Terms of Use.