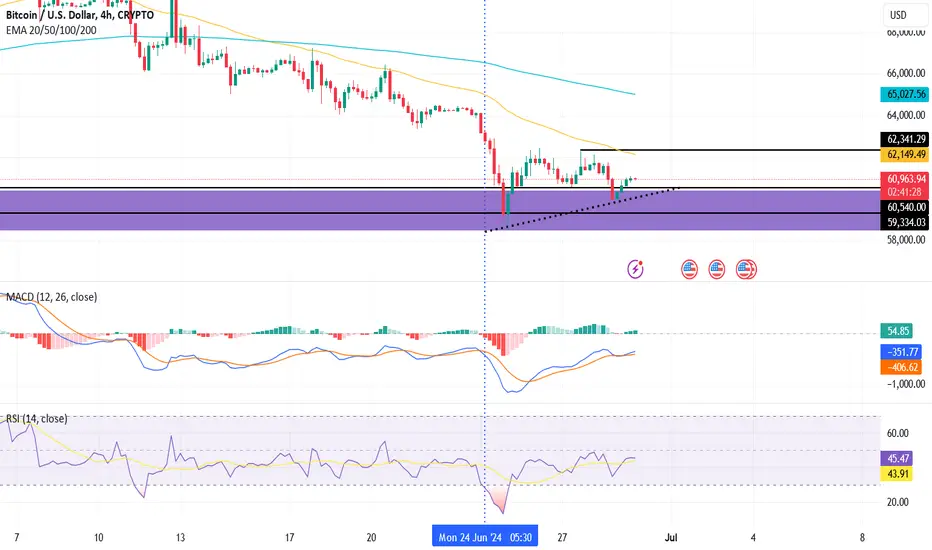
Looking at the 4-h chart of BTC, the BTC has been following an upward trendline, where the short-term hurdle looks to be at $62,340. The BTC buyers are trying to surge as it approaches the dynamic resistances of 50-day and 200-day EMA bands.
The MACD indicator has shown a bullish cross in the bearish vicinity of the indicator; with the growing histogram at 53.32, it looks clear that BTC is primed to rise in the short term.
Meanwhile, the RSI flashed at 45.07, and it has taken support from 14-SMA. Thus, the curve shows that the price has been recovering from extreme oversold of 20 to the overbough territory.
Therefore, if the price continues to ride the trendline over the 4-H chart, the resistance would be $62341 and $64555. Meanwhile, if the price declines below trendline support, the nearest support could be at $59980 and $59242.
Disclaimer
The information and publications are not meant to be, and do not constitute, financial, investment, trading, or other types of advice or recommendations supplied or endorsed by TradingView. Read more in the Terms of Use.
Disclaimer
The information and publications are not meant to be, and do not constitute, financial, investment, trading, or other types of advice or recommendations supplied or endorsed by TradingView. Read more in the Terms of Use.