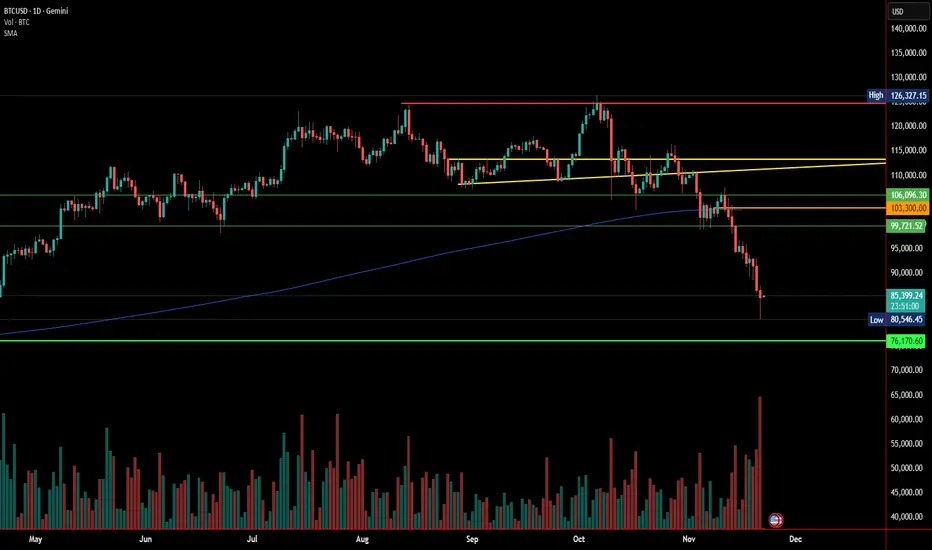
Bitcoin’s climb to 126,327.15 now reads like the last breath of a fading trend. That high wasn’t just a price point it was the last surge of bullish confidence before the chart quietly and consistently began breaking down.
Lower highs formed, momentum weakened, and what looked like healthy consolidation slowly revealed itself as exhaustion. The rising triangle that once hinted at continuation eventually failed. Buyers couldn’t break the ceiling, sellers kept pressing the floor, and the entire formation finally snapped.
When Bitcoin fell out of that triangle, it didn’t stumble it collapsed. The real damage came when price cut straight through the 50-week SMA, the line that separates long-term strength from long-term weakness. This weekly moving average has defined every Bitcoin cycle since Bitcoin’s inception. Staying above it signals a healthy macro trend; falling below it signals a corrective phase.
The break this time wasn’t subtle. A heavy red candle with the largest sell volume on the chart sliced through the 50-week SMA. That’s what capitulation looks like.
Currently, Bitcoin sits below the 50-week SMA. For BTC to turn bullish again, it must reclaim that line no exceptions, no shortcuts. Anyone talking about $200,000 Bitcoin should note that until BTC gets back above $103,300, the macro bullish thesis is paused.
Michael Saylor has been a prominent figure in the Bitcoin narrative, often associated with large-scale accumulation through corporate channels. As the market adjusts, we may soon see Bitcoin’s price reflect its true, organic strength or weakness, independent of corporate sentiment.
Nothing has changed since my last view. My targets remain:
Until Bitcoin reclaims the 50-week SMA and rises above 103,300, the macro trend remains tilted downward. The market is approaching a moment where Bitcoin stands fully on its own without corporate lifelines or narrative amplification.
Form my last post, my views still stand for price TR.
Lower highs formed, momentum weakened, and what looked like healthy consolidation slowly revealed itself as exhaustion. The rising triangle that once hinted at continuation eventually failed. Buyers couldn’t break the ceiling, sellers kept pressing the floor, and the entire formation finally snapped.
When Bitcoin fell out of that triangle, it didn’t stumble it collapsed. The real damage came when price cut straight through the 50-week SMA, the line that separates long-term strength from long-term weakness. This weekly moving average has defined every Bitcoin cycle since Bitcoin’s inception. Staying above it signals a healthy macro trend; falling below it signals a corrective phase.
The break this time wasn’t subtle. A heavy red candle with the largest sell volume on the chart sliced through the 50-week SMA. That’s what capitulation looks like.
Currently, Bitcoin sits below the 50-week SMA. For BTC to turn bullish again, it must reclaim that line no exceptions, no shortcuts. Anyone talking about $200,000 Bitcoin should note that until BTC gets back above $103,300, the macro bullish thesis is paused.
Michael Saylor has been a prominent figure in the Bitcoin narrative, often associated with large-scale accumulation through corporate channels. As the market adjusts, we may soon see Bitcoin’s price reflect its true, organic strength or weakness, independent of corporate sentiment.
Nothing has changed since my last view. My targets remain:
- $89,000 – initial support, now under pressure
- $83,000 – major demand zone
- $76,000 – deeper correction territory
- $58,000 – full cycle flush if panic accelerates
Until Bitcoin reclaims the 50-week SMA and rises above 103,300, the macro trend remains tilted downward. The market is approaching a moment where Bitcoin stands fully on its own without corporate lifelines or narrative amplification.
Form my last post, my views still stand for price TR.
Related publications
Disclaimer
The information and publications are not meant to be, and do not constitute, financial, investment, trading, or other types of advice or recommendations supplied or endorsed by TradingView. Read more in the Terms of Use.
Related publications
Disclaimer
The information and publications are not meant to be, and do not constitute, financial, investment, trading, or other types of advice or recommendations supplied or endorsed by TradingView. Read more in the Terms of Use.