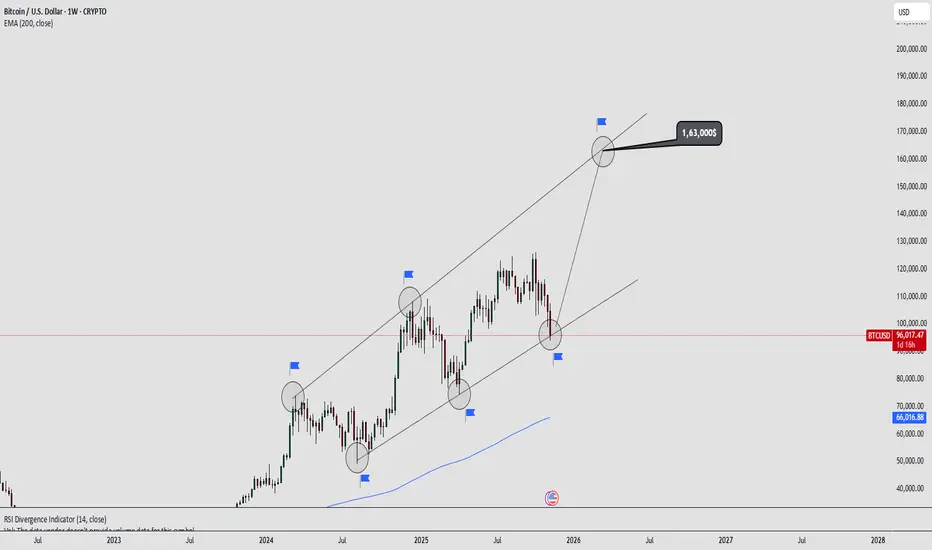
Bitcoin is currently respecting a multi-year ascending channel on the weekly chart. The price recently touched the lower trendline support, suggesting that the long-term structure is still intact.
This setup highlights a classic “higher highs and higher lows” pattern within the parallel channel, showing that BTC continues to follow its historical rhythm of expansion and correction phases.
Observations:
• Channel support: around $90,000 – $95,000 zone
• Channel resistance: projected near $160,000 – $165,000
• 200 EMA on the weekly chart near $66,000 providing long-term trend support
• RSI showing signs of recovery from the mid-zone
Technical Outlook:
If Bitcoin maintains the current channel support and forms a bullish reversal candle on the weekly close, the next leg of the rally could target $160K+ within the same channel structure.
Invalidation occurs on a confirmed weekly close below $90K, which would signal a potential trend shift.
Market Sentiment: Bullish (Long-Term)
Timeframe: Weekly
Style: Positional / Long-Term Analysis
Disclaimer: This is a personal technical view for educational purposes, not financial advice.
Disclaimer
The information and publications are not meant to be, and do not constitute, financial, investment, trading, or other types of advice or recommendations supplied or endorsed by TradingView. Read more in the Terms of Use.
Disclaimer
The information and publications are not meant to be, and do not constitute, financial, investment, trading, or other types of advice or recommendations supplied or endorsed by TradingView. Read more in the Terms of Use.