Title:
Catch Trends Early with Parabolic SAR + QMA Combo! 🚀 (BTC/USD Example)
⸻
Here’s a simple but powerful trend-following strategy I personally use — combining Parabolic SAR with Quantum Moving Average (QMA).
Works great on Bitcoin, Gold, Nifty, and other trending assets.
⸻
How it Works:
1. Identify the Trend:
• When price is below QMA and Parabolic SAR dots are above price → strong downtrend
• When price is above QMA and Parabolic SAR dots are below price → strong uptrend
2. Confirm Entry After Reversal:
• Wait for price to close above QMA and SAR dots flip below price for a long setup
• Wait for price to close below QMA and SAR dots flip above price for a short setup
⸻
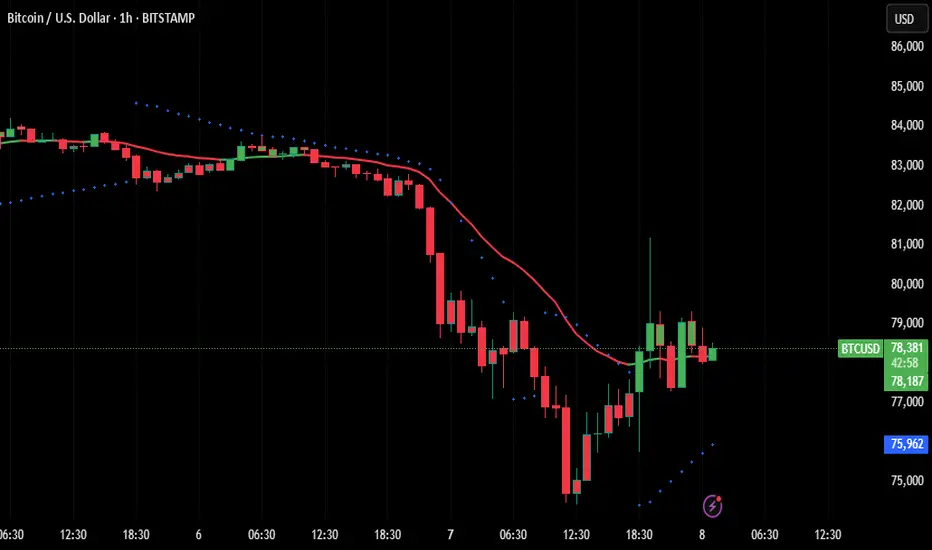
Real Example (BTC/USD 1H Chart):
• After a heavy downtrend, price broke above QMA and Parabolic SAR flipped below.
• This suggests a possible early trend reversal toward the upside.
If the setup holds, BTC could move back toward higher fib levels or supply zones.
⸻
Why I Love This Combo:
• Easy visual confirmation (SAR dots + moving average)
• Works well on 1H and 4H charts for swing trading
• Filters out false breakouts and sideways chop
⸻
Backtest this simple combo on your favorite assets and see the magic!
⸻
Found this helpful? Tap LIKE ❤ & FOLLOW ➕ for more strategies shared weekly!
⸻
#BTCUSD #Bitcoin #ParabolicSAR #TrendFollowing #TradingStrategy #QMA #TechnicalAnalysis #PriceAction #ForexStrategy #CryptoTrading
Catch Trends Early with Parabolic SAR + QMA Combo! 🚀 (BTC/USD Example)
⸻
Here’s a simple but powerful trend-following strategy I personally use — combining Parabolic SAR with Quantum Moving Average (QMA).
Works great on Bitcoin, Gold, Nifty, and other trending assets.
⸻
How it Works:
1. Identify the Trend:
• When price is below QMA and Parabolic SAR dots are above price → strong downtrend
• When price is above QMA and Parabolic SAR dots are below price → strong uptrend
2. Confirm Entry After Reversal:
• Wait for price to close above QMA and SAR dots flip below price for a long setup
• Wait for price to close below QMA and SAR dots flip above price for a short setup
⸻
Real Example (BTC/USD 1H Chart):
• After a heavy downtrend, price broke above QMA and Parabolic SAR flipped below.
• This suggests a possible early trend reversal toward the upside.
If the setup holds, BTC could move back toward higher fib levels or supply zones.
⸻
Why I Love This Combo:
• Easy visual confirmation (SAR dots + moving average)
• Works well on 1H and 4H charts for swing trading
• Filters out false breakouts and sideways chop
⸻
Backtest this simple combo on your favorite assets and see the magic!
⸻
Found this helpful? Tap LIKE ❤ & FOLLOW ➕ for more strategies shared weekly!
⸻
#BTCUSD #Bitcoin #ParabolicSAR #TrendFollowing #TradingStrategy #QMA #TechnicalAnalysis #PriceAction #ForexStrategy #CryptoTrading
Disclaimer
The information and publications are not meant to be, and do not constitute, financial, investment, trading, or other types of advice or recommendations supplied or endorsed by TradingView. Read more in the Terms of Use.
Disclaimer
The information and publications are not meant to be, and do not constitute, financial, investment, trading, or other types of advice or recommendations supplied or endorsed by TradingView. Read more in the Terms of Use.