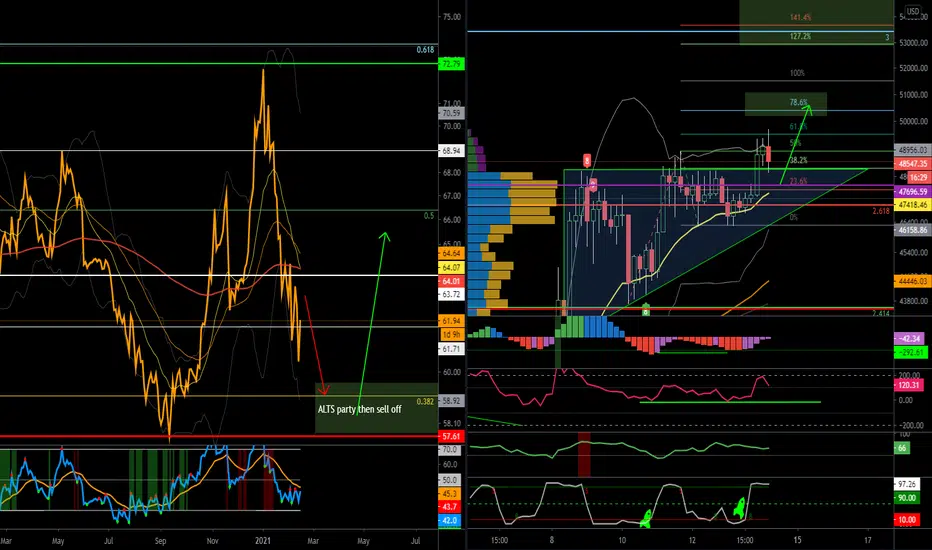
after my last post for BTC ive updated chart slightly. we have confirmed our bull flag although not much follow though yet. we r looking to confirm the ascending triangle as i type, which will take us up to the 55k area. We are testing what was resistance as support right now. If we hold, we are going to the next green box around the 0.786 fib extension. Alts are going to continue to drop fo a bit then they will start to party. i wud be careful because the BTC.D(dominance) chart is in a range and most likely will see a a bounce back to the 0.50 fib level. keep eye on the range for BTC.D when breaks we will see some Big moves
green lines i draw on indicators are usually hidden div or a level i use for entry ex.. when in uptrend making hidden bull div then we crossing up thru -275 on histogram as negaitve momo fades
green lines i draw on indicators are usually hidden div or a level i use for entry ex.. when in uptrend making hidden bull div then we crossing up thru -275 on histogram as negaitve momo fades
Disclaimer
The information and publications are not meant to be, and do not constitute, financial, investment, trading, or other types of advice or recommendations supplied or endorsed by TradingView. Read more in the Terms of Use.
Disclaimer
The information and publications are not meant to be, and do not constitute, financial, investment, trading, or other types of advice or recommendations supplied or endorsed by TradingView. Read more in the Terms of Use.