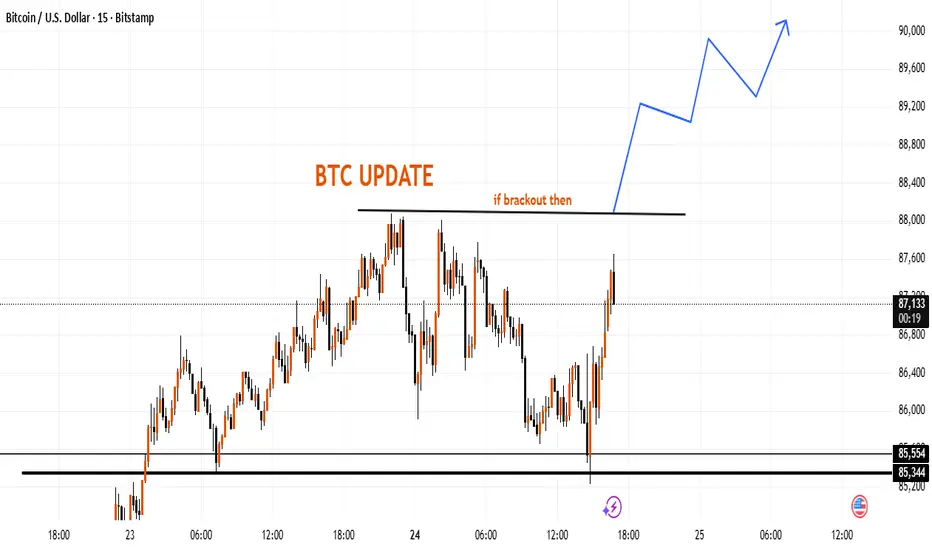
This chart highlights an important resistance zone around the 88,000 area. If price manages to move firmly above this level, the market may continue forming a higher-timeframe structure toward the 89,000–90,000 region.
The lower zone near 85,300–85,550 remains a notable support area where previous reactions occurred.
This outline is based purely on market structure and potential price behavior, not a trading instruction.
The lower zone near 85,300–85,550 remains a notable support area where previous reactions occurred.
This outline is based purely on market structure and potential price behavior, not a trading instruction.
Trade active
its time to trade activeTrade closed: target reached
target compleateDisclaimer
The information and publications are not meant to be, and do not constitute, financial, investment, trading, or other types of advice or recommendations supplied or endorsed by TradingView. Read more in the Terms of Use.
Disclaimer
The information and publications are not meant to be, and do not constitute, financial, investment, trading, or other types of advice or recommendations supplied or endorsed by TradingView. Read more in the Terms of Use.