Market Structure
The chart shows multiple Break of Structure (BOS) events marked with labels.
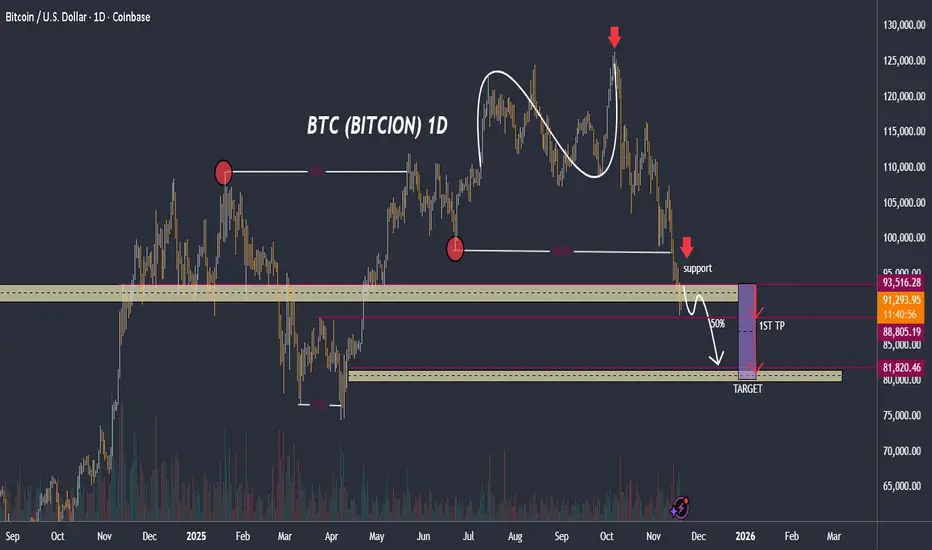
The most recent BOS is bearish, confirming a shift in momentum from higher-timeframe distribution to a downtrend.
After the final local high (where a red arrow is marked), price makes lower highs and lower lows, forming a classical rounded top pattern.
2. Key Levels
Major support zone (current interaction)
Price is currently dropping into a large demand zone highlighted in beige.
This area previously acted as support and served as the origin of a strong rally earlier in the chart.
The chart depicts price breaking below that support, indicating a bearish continuation.
50% Retracement
A white arrow indicates a retrace back to the 50% level, suggesting:
A possible short-term bullish pullback.
A potential area for sellers to re-enter.
First Take Profit (1st TP)
Marked at roughly $88,800 level (pink horizontal line).
This aligns with mid-range liquidity and a previous consolidation low.
Main Target Zone
Highlighted in purple and beige at roughly $81,800.
This corresponds to:
A deeper demand zone
Fair value gap (FVG) fill
Previous unmitigated imbalance (seen earlier in the chart)
This seems to be the analyst’s primary target for the sell-side move.
3. Fair Value Gap (FVG)
An earlier FVG is marked around the March–April area.
The current downtrend is likely aiming to mitigate this inefficiency.
4. Liquidity Considerations
Red circles indicate liquidity grabs.
The rounded top shows distribution, sweeping highs before reversing.
Now liquidity sits:
Below recent lows
Inside the target zone
This supports a downward continuation.
5. Overall Interpretation
The chart suggests the trader anticipates:
1. Breakdown through support (already happening)
2. A corrective move upward (50% retrace)
3. Continuation downward to the first TP
4. Final sweep into the major target zone around $81.8k
In summary, the chart displays a bearish continuation setup targeting deep liquidity zones and imbalance fills.
---
If you'd like, I can also prepare:
✓ A written title for this analysis
✓ A trading plan summary
✓ A bullish vs. bearish scenario breakdown
✓ A simplified explanation if you're new to smart money concepts (BOS, FVG, liquidity)
The chart shows multiple Break of Structure (BOS) events marked with labels.
The most recent BOS is bearish, confirming a shift in momentum from higher-timeframe distribution to a downtrend.
After the final local high (where a red arrow is marked), price makes lower highs and lower lows, forming a classical rounded top pattern.
2. Key Levels
Major support zone (current interaction)
Price is currently dropping into a large demand zone highlighted in beige.
This area previously acted as support and served as the origin of a strong rally earlier in the chart.
The chart depicts price breaking below that support, indicating a bearish continuation.
50% Retracement
A white arrow indicates a retrace back to the 50% level, suggesting:
A possible short-term bullish pullback.
A potential area for sellers to re-enter.
First Take Profit (1st TP)
Marked at roughly $88,800 level (pink horizontal line).
This aligns with mid-range liquidity and a previous consolidation low.
Main Target Zone
Highlighted in purple and beige at roughly $81,800.
This corresponds to:
A deeper demand zone
Fair value gap (FVG) fill
Previous unmitigated imbalance (seen earlier in the chart)
This seems to be the analyst’s primary target for the sell-side move.
3. Fair Value Gap (FVG)
An earlier FVG is marked around the March–April area.
The current downtrend is likely aiming to mitigate this inefficiency.
4. Liquidity Considerations
Red circles indicate liquidity grabs.
The rounded top shows distribution, sweeping highs before reversing.
Now liquidity sits:
Below recent lows
Inside the target zone
This supports a downward continuation.
5. Overall Interpretation
The chart suggests the trader anticipates:
1. Breakdown through support (already happening)
2. A corrective move upward (50% retrace)
3. Continuation downward to the first TP
4. Final sweep into the major target zone around $81.8k
In summary, the chart displays a bearish continuation setup targeting deep liquidity zones and imbalance fills.
---
If you'd like, I can also prepare:
✓ A written title for this analysis
✓ A trading plan summary
✓ A bullish vs. bearish scenario breakdown
✓ A simplified explanation if you're new to smart money concepts (BOS, FVG, liquidity)
Trade active
Trade closed: target reached
Target has been hit — next trade setup below1) If your previous target has been reached
Since the chart’s TARGET zone (≈ 81,820) has been hit:
✔️ What you should do now:
Lock in profits (if not already done).
Reset your bias and look for the next clean entry instead of chasing the move.
2) New Trade Setup (Short Position on Pullback)
If you want to catch another move down (as your message suggests “hit again”), here is the clean, structured setup:
🔹 Short Entry Zone:
88,700 – 89,000
(This is the 50% pullback zone highlighted on your chart.)
🔹 Stop Loss:
93,600 – 94,000
(Above the resistance and previous BOS area.)
🔹 Take Profit (TP1):
84,300
(Current support + mid-range liquidity.)
🔹 Take Profit (TP2 – Final Target):
81,820
(The same strong demand/target level marked on your chart.)
🔹 Risk–Reward:
Strong R:R if you hold to TP2.
3) Optional Long Setup (Buy-the-Dip Plan)
If BTC gives a bullish reaction from the strong support:
🔹 Long Entry Zone:
81,700 – 82,200
🔹 Stop Loss:
79,500
🔹 Take Profit 1:
88,800
🔹 Take Profit 2:
93,500
4) Risk Management Rules
Risk only 1–2% of your account per trade.
Wait for confirmation: wick rejection, bullish/bearish engulfing, volume spike.
Never chase a candle; let price return to your level.
If BTC reclaims 93,500, the bearish setup becomes invalid.
5) If You Want a Ready-to-Copy Order
I can prepare a clean copy-paste format like:
BTCUSD SHORT
Entry: 88,700 – 89,000
SL: 93,800
TP1: 84,300
TP2: 81,820
Risk: 1–2%
Market Analyst | Forex Mentor | XAUUSD Specialist
Services Offered:
• VIP Signals
• 1-on-1 Mentorship
• Professional Forex Course
• Affiliate Program
• Strategic Partnerships
Link to Join
t.me/Boomingbulls_Signals1
Services Offered:
• VIP Signals
• 1-on-1 Mentorship
• Professional Forex Course
• Affiliate Program
• Strategic Partnerships
Link to Join
t.me/Boomingbulls_Signals1
Disclaimer
The information and publications are not meant to be, and do not constitute, financial, investment, trading, or other types of advice or recommendations supplied or endorsed by TradingView. Read more in the Terms of Use.