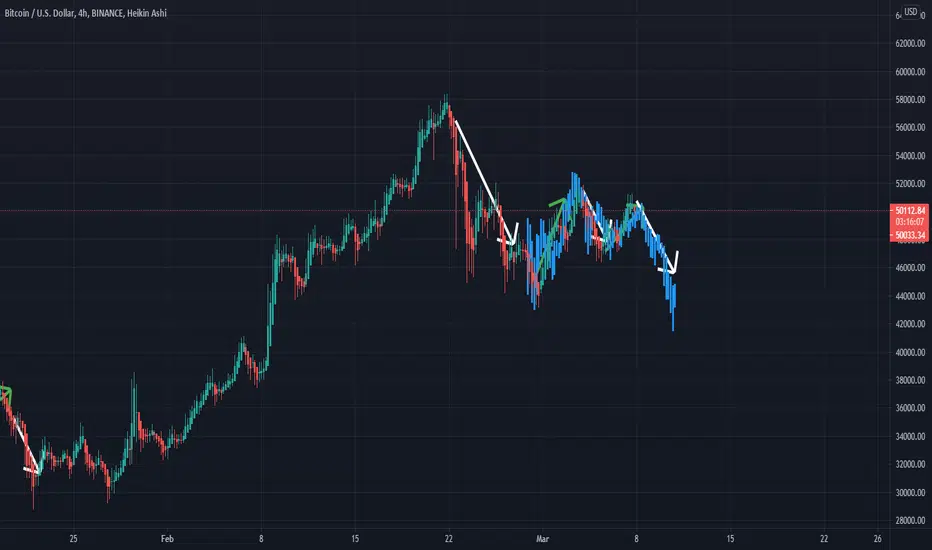
This chart showcases the movements BTC made during the previous big dump from 42k-28k during this bullrun. I provided the same movements with arrows, as well as a fractal of the previous dip. It showcases a big dump coming the following days.
Note
Still expect this big dip to come the following days, might go up a bit, but once we start falling we'll fall hard imo.Note
Quick update: See my twitter @PanfuZeldaNow we wait what the market tells us, if we break 55k we're going up, if not, we're about to see a huge dump. Afterwards we start the next leg up for a new all time high, golden opportunity to open a leveraged long, I will be doing so myself, currently no positions.
Disclaimer
The information and publications are not meant to be, and do not constitute, financial, investment, trading, or other types of advice or recommendations supplied or endorsed by TradingView. Read more in the Terms of Use.
Disclaimer
The information and publications are not meant to be, and do not constitute, financial, investment, trading, or other types of advice or recommendations supplied or endorsed by TradingView. Read more in the Terms of Use.
