Welcome Back To My Page.
Very Simple Chart.
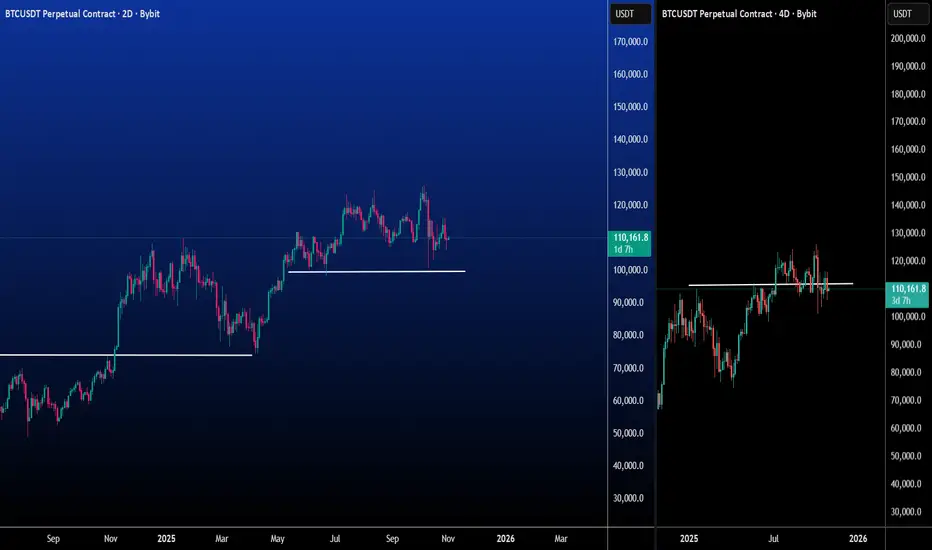
-> First Trend Line
-> Second Trend Line
As we see the the pullback from the first Trend Line in Left Graph, Right Side Graph shows that Price got rejected from it's ATH and looking to take the support at Second Trend Line.
Like If your view align with my view.
Make sure any strong new now capable to Dump the price so take this advantage as December arrives soon.
Note : This is not a financial advice. Made just for Educational purpose
Very Simple Chart.
-> First Trend Line
-> Second Trend Line
As we see the the pullback from the first Trend Line in Left Graph, Right Side Graph shows that Price got rejected from it's ATH and looking to take the support at Second Trend Line.
Like If your view align with my view.
Make sure any strong new now capable to Dump the price so take this advantage as December arrives soon.
Note : This is not a financial advice. Made just for Educational purpose
Note
It was small typing mistake but no mistakes in Chart. As Clearly mentioned December Month is coming and Selling is already started.Disclaimer
The information and publications are not meant to be, and do not constitute, financial, investment, trading, or other types of advice or recommendations supplied or endorsed by TradingView. Read more in the Terms of Use.
Disclaimer
The information and publications are not meant to be, and do not constitute, financial, investment, trading, or other types of advice or recommendations supplied or endorsed by TradingView. Read more in the Terms of Use.