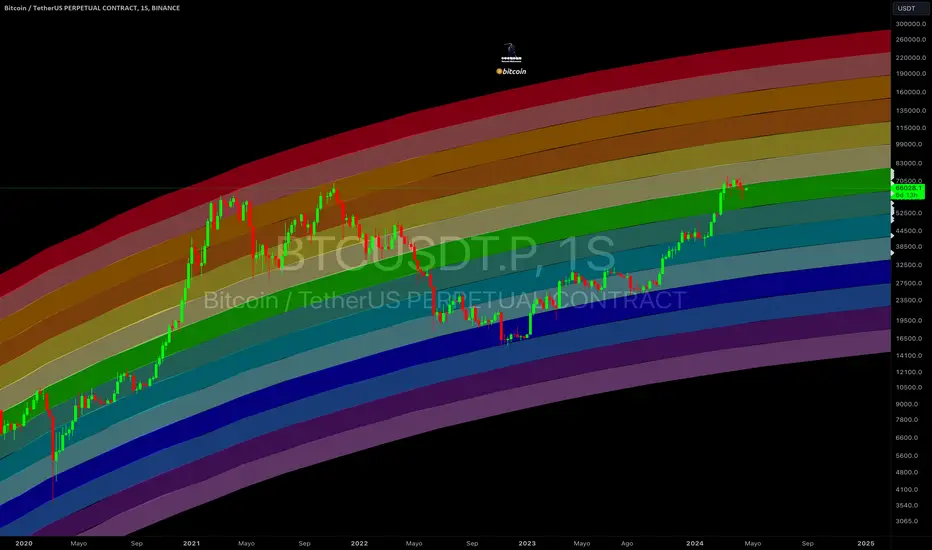
Gráfico arcoíris de Bitcoin BTC🌈El canal colorido es la línea de resistencia para el aumento de los precios de Bitcoin y la línea de soporte para la caída. El azul y el morado son la parte inferior, el azul fluorescente y el verde son los relés, el verde y el amarillo son la vía intermedia, y el naranja y el rojo. son los mejores.
📊💵👍🏻65%~99.99%👌🏻
Disclaimer
The information and publications are not meant to be, and do not constitute, financial, investment, trading, or other types of advice or recommendations supplied or endorsed by TradingView. Read more in the Terms of Use.
📊💵👍🏻65%~99.99%👌🏻
Disclaimer
The information and publications are not meant to be, and do not constitute, financial, investment, trading, or other types of advice or recommendations supplied or endorsed by TradingView. Read more in the Terms of Use.