📊 BTC/USDT Technical Analysis – Key Levels & Outlook 🚀🔻
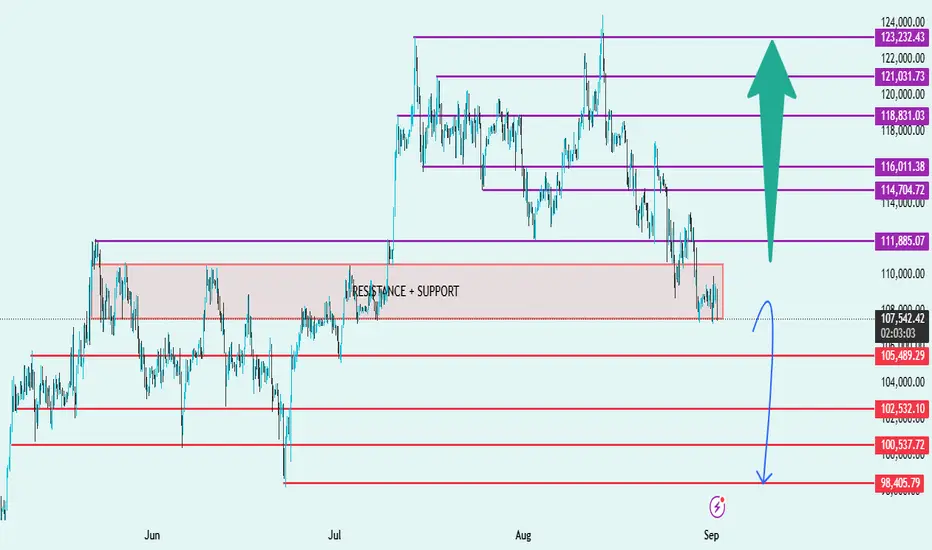
The chart shows Bitcoin (BTC/USDT) trading around 109,066 with clear support & resistance zones marked. Let’s break it down professionally with key levels:
🔑 Key Support & Resistance Zones
🟪 Major Resistances (Upside Targets):
111,885 🟪
114,704 🟪
116,011 🟪
118,831 🟪
121,031 🟪
123,223 – 124,000 (Strong resistance ceiling 🚧🔥)
🔴 Major Supports (Downside Protection):
105,489 🔴
102,532 🔴
100,537 🔴
98,405 (Critical breakdown level ⚠️)
📈 Bullish Scenario (Green Arrow 🚀)
If BTC holds above 109,000–110,000 support, we may see a push towards 111,885 first, followed by 114,704 → 118,831 → 121,031.
Strong momentum could even test 123,223 – 124,000, which is the ultimate resistance zone.
📉 Bearish Scenario (Blue Arrow 🔻)
If BTC fails to hold 109,000, price may drop towards 105,489 → 102,532 → 100,537.
A strong breakdown below 98,405 would signal deeper weakness, opening doors to further decline. ⚠️
🎯 Conclusion
Market is currently in a decision zone (109K area).
✅ Holding above 109K = bullish continuation 🚀
❌ Breaking below 109K = bearish drop 🔻
📌 Traders should watch 109,000 closely as the pivot point.
Trade active
Related publications
Disclaimer
The information and publications are not meant to be, and do not constitute, financial, investment, trading, or other types of advice or recommendations supplied or endorsed by TradingView. Read more in the Terms of Use.
Related publications
Disclaimer
The information and publications are not meant to be, and do not constitute, financial, investment, trading, or other types of advice or recommendations supplied or endorsed by TradingView. Read more in the Terms of Use.