What's up traders! 👋
Wedge patterns are a powerful tool in technical analysis that can give you a heads-up about potential price moves. Whether you’re spotting a falling wedge or a rising wedge, these formations can reveal key signals about market direction.
What’s a Wedge Pattern?
A wedge pattern forms when price moves between two converging trendlines, creating a shape resembling a triangle. These patterns usually appear when the market is slowing down or consolidating before making a bigger move. Wedges can slope upwards or downwards, and the key difference lies in whether the trendlines are converging in an uptrend (rising wedge) or a downtrend (falling wedge).
Falling Wedge Pattern: Bullish Reversal 📈
The falling wedge pattern is a bullish reversal signal. This formation occurs when price moves between two downward-sloping trendlines, creating a series of lower highs and lower lows. The downward momentum weakens as the trendlines converge, indicating that sellers are losing strength, which sets up the potential for a bullish breakout.
How to Trade the Falling Wedge

The chart illustrates a falling wedge pattern on the Bitcoin / Tether US pair with a 1-hour timeframe. Price action is contained within two converging downward-sloping trendlines, suggesting weakening bearish momentum. The breakout above the upper trendline signals a bullish reversal, and the subsequent uptick in price confirms the shift in momentum.
In rare cases, a breakout failure can lead to a bearish falling wedge pattern, but this scenario is less common. Keep an eye on the price action for signs of continued upward momentum.
Rising Wedge Pattern: Bearish Reversal 📉
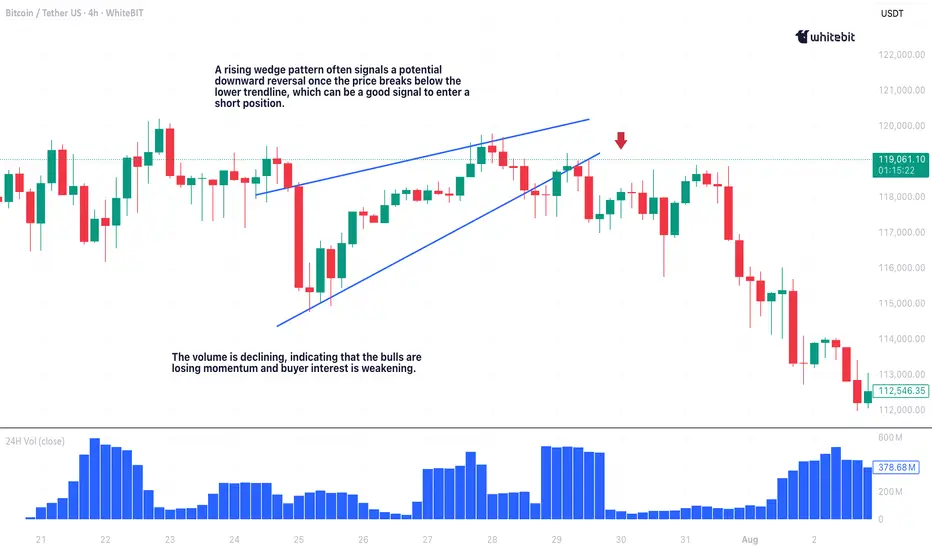
The rising wedge pattern is a bearish reversal signal. This formation happens when price moves between two upward-sloping trendlines, creating higher highs and higher lows. The rising wedge indicates weakening buying pressure and a potential reversal to the downside.
How to Trade the Rising Wedge
Wedge Chart Pattern Trading: Key Tips ⚡
Context is everything when trading wedge patterns. If a bullish wedge pattern appears in an uptrend, it’s more likely to break to the upside. If a bearish wedge shows up in a downtrend, expect a breakdown.
Here are a few quick tips to improve your wedge trading pattern game:
Final Thoughts 🏁
Wedge patterns, whether it’s the falling wedge pattern signaling a bullish reversal or the rising wedge pattern trading indicating bearish pressure, are some of the most reliable chart formations out there. But remember: no setup is perfect, so always use a stop loss and never rely on a single indicator.
With practice, you’ll get better at spotting these setups and timing your entries and exits like a pro. Happy trading, and may the charts be in your favor! 💰📊
Wedge patterns are a powerful tool in technical analysis that can give you a heads-up about potential price moves. Whether you’re spotting a falling wedge or a rising wedge, these formations can reveal key signals about market direction.
What’s a Wedge Pattern?
A wedge pattern forms when price moves between two converging trendlines, creating a shape resembling a triangle. These patterns usually appear when the market is slowing down or consolidating before making a bigger move. Wedges can slope upwards or downwards, and the key difference lies in whether the trendlines are converging in an uptrend (rising wedge) or a downtrend (falling wedge).
Falling Wedge Pattern: Bullish Reversal 📈
The falling wedge pattern is a bullish reversal signal. This formation occurs when price moves between two downward-sloping trendlines, creating a series of lower highs and lower lows. The downward momentum weakens as the trendlines converge, indicating that sellers are losing strength, which sets up the potential for a bullish breakout.
How to Trade the Falling Wedge
- Entry: Wait for the price to break above the upper trendline. This is your signal to enter long.
- Target: Measure the height of the wedge at its widest point and project it upwards from the breakout point.
- Stop Loss: Place it just below the most recent swing low to protect your position if the breakout doesn’t happen.
The chart illustrates a falling wedge pattern on the Bitcoin / Tether US pair with a 1-hour timeframe. Price action is contained within two converging downward-sloping trendlines, suggesting weakening bearish momentum. The breakout above the upper trendline signals a bullish reversal, and the subsequent uptick in price confirms the shift in momentum.
In rare cases, a breakout failure can lead to a bearish falling wedge pattern, but this scenario is less common. Keep an eye on the price action for signs of continued upward momentum.
Rising Wedge Pattern: Bearish Reversal 📉
The rising wedge pattern is a bearish reversal signal. This formation happens when price moves between two upward-sloping trendlines, creating higher highs and higher lows. The rising wedge indicates weakening buying pressure and a potential reversal to the downside.
How to Trade the Rising Wedge
- Entry: Enter a short position once the price breaks below the lower trendline.
- Target: Measure the height of the wedge and project it downward from the breakout point.
- Stop Loss: Set it just above the most recent swing high to protect your trade.
Wedge Chart Pattern Trading: Key Tips ⚡
Context is everything when trading wedge patterns. If a bullish wedge pattern appears in an uptrend, it’s more likely to break to the upside. If a bearish wedge shows up in a downtrend, expect a breakdown.
Here are a few quick tips to improve your wedge trading pattern game:
- Trendlines are key: Ensure your trendlines are drawn accurately. Properly drawn trendlines lead to better trades.
- Breakout confirmation: Confirm breakouts with increased volume and, ideally, by checking for confluence with other indicators like RSI or MACD. A breakout without volume is often a false signal.
- Risk management: Always use a stop loss to protect your capital.
- Use other indicators: Wedge patterns work well with additional tools such as RSI, moving averages, or MACD. The more confluence, the better!
Final Thoughts 🏁
Wedge patterns, whether it’s the falling wedge pattern signaling a bullish reversal or the rising wedge pattern trading indicating bearish pressure, are some of the most reliable chart formations out there. But remember: no setup is perfect, so always use a stop loss and never rely on a single indicator.
With practice, you’ll get better at spotting these setups and timing your entries and exits like a pro. Happy trading, and may the charts be in your favor! 💰📊
Disclaimer
The information and publications are not meant to be, and do not constitute, financial, investment, trading, or other types of advice or recommendations supplied or endorsed by TradingView. Read more in the Terms of Use.
Disclaimer
The information and publications are not meant to be, and do not constitute, financial, investment, trading, or other types of advice or recommendations supplied or endorsed by TradingView. Read more in the Terms of Use.