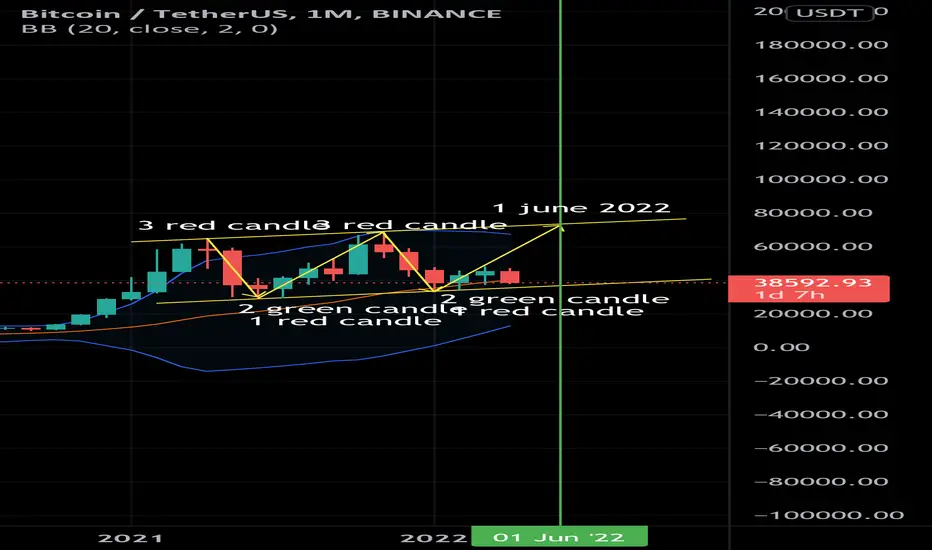
If we look at bitcoin monthly chart, we can clearly see it similar pattern and candlestick.
With 3 red bearish candle, following by 2 green candle, and 1 red candle.
If the history will repeat itself, then we will see massive pump in May and probably reach bitcoin altimehigh at the first june 2022
What do you think?
With 3 red bearish candle, following by 2 green candle, and 1 red candle.
If the history will repeat itself, then we will see massive pump in May and probably reach bitcoin altimehigh at the first june 2022
What do you think?
Disclaimer
The information and publications are not meant to be, and do not constitute, financial, investment, trading, or other types of advice or recommendations supplied or endorsed by TradingView. Read more in the Terms of Use.
Disclaimer
The information and publications are not meant to be, and do not constitute, financial, investment, trading, or other types of advice or recommendations supplied or endorsed by TradingView. Read more in the Terms of Use.