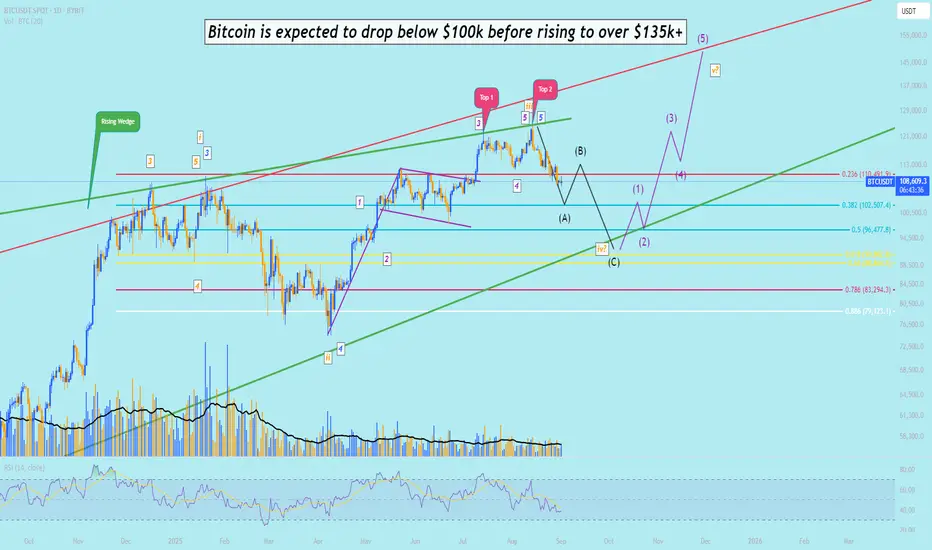
- Rising wedge + double top: Price formed a rising wedge and a double-top — both are bearish reversal patterns. A decisive break of the wedge and double-top neckline raises the probability of a meaningful pullback. 🔺🔻
- Volume/momentum confirm: Rising wedge rallies often show weakening momentum and lower volume on advances. Watch for bearish divergence on RSI and higher selling volume on the break. 📉📉
- Elliott wave read: Wave 3 appears complete. The market is in an ABC correction for wave 4 (choppy corrective action). Wave 5 is still possible after wave 4 finishes. 🌊3➡️🔁➡️5️⃣
Completion of ABC structure — clear C-leg low. ✔️
- Price in a key Fibonacci retracement of wave 3 (0.382-102507/0.5-96477/0.618-90802/0.786-83294). 🎯
- Momentum divergence resolves and momentum turns bullish (RSI/stoch up). 📈
- Volume pattern shifts: selling volume dries up, buying volume returns on rallies. 📊
- Structure flip: higher highs and higher lows on daily closes. 🔁🏗️
September seasonality can be challenging for Bitcoin — this historically increases probability of deeper/longer corrections. 🍂
- Positivity: “end of the pain is near” fits the Elliott narrative — after wave 4 completes, distribution/accumulation can set the stage for a final wave 5 thrust. 🙌
This is technical analysis, not financial advice. Confirm pattern breaks on your own charts, watch volume and momentum, manage risk, and adapt to evolving price action.
Please do not forget the ✅' like'✅ button 🙏😊 & Share it with your friends; thanks, and Trade safe.Please do not forget the ✅' like'✅ button 🙏😊 & Share it with your friends; thanks, and Trade safe!
👇 Website
srfxglobal.com/
👇 Telegram
t.me/SRFXGlobal
👇 YouTube
youtube.com/@srfxglobalsl?si=hbM2z2PURtIHCQvz
👇 X
x.com/SRFL1111
👇 Facebook
web.facebook.com/Friendship0002
srfxglobal.com/
👇 Telegram
t.me/SRFXGlobal
👇 YouTube
youtube.com/@srfxglobalsl?si=hbM2z2PURtIHCQvz
👇 X
x.com/SRFL1111
web.facebook.com/Friendship0002
Disclaimer
The information and publications are not meant to be, and do not constitute, financial, investment, trading, or other types of advice or recommendations supplied or endorsed by TradingView. Read more in the Terms of Use.