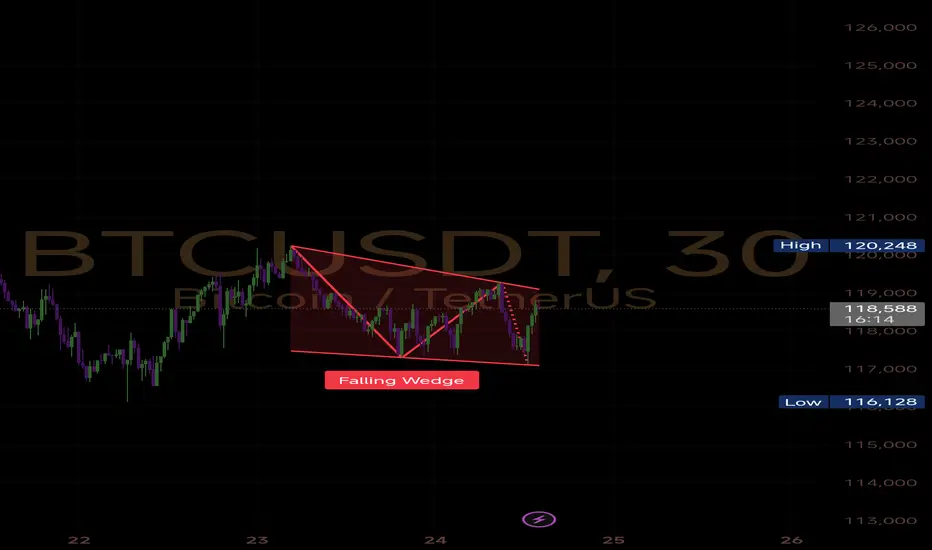
A classic Falling Wedge pattern just broke out on the 30mins timeframe, signaling a potential short-term bullish reversal for #Bitcoin.
🔻 Pattern: Falling Wedge
📍 Support held firm near $116,128
📍 Breakout confirmation above $118,500
🟢 Bullish Confirmation:
A sustained hold above $118.6K could trigger bullish continuation
⚠️ Watching $117.7K as retest zone for dip entries
🔴 Invalidation Zone:
Break below $116.1K invalidates wedge breakout
Next Targets (if breakout holds): $119.3K, $120.2K, $121.5K+ (extension)
🛑 STOPLOSS : $116.1K
Disclaimer
The information and publications are not meant to be, and do not constitute, financial, investment, trading, or other types of advice or recommendations supplied or endorsed by TradingView. Read more in the Terms of Use.
Disclaimer
The information and publications are not meant to be, and do not constitute, financial, investment, trading, or other types of advice or recommendations supplied or endorsed by TradingView. Read more in the Terms of Use.