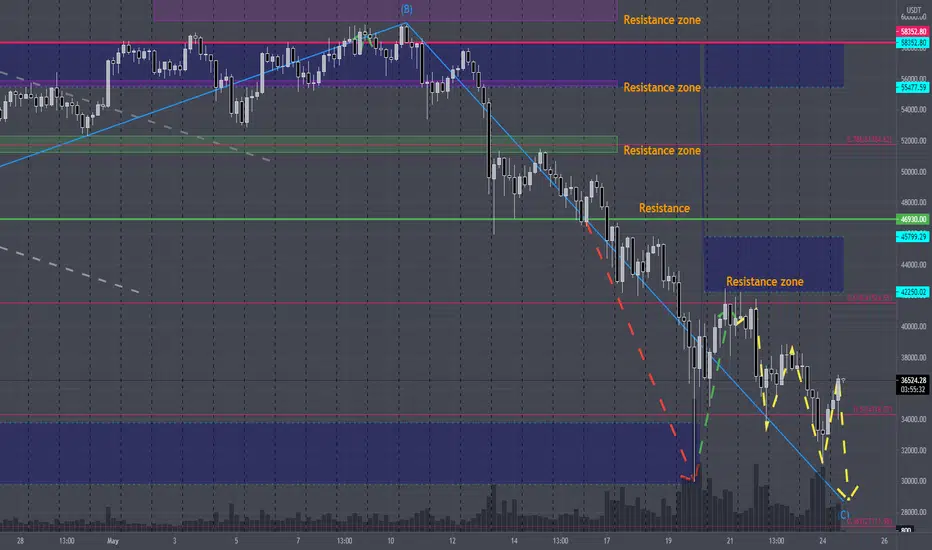
There is the somewhat strong resistance zone from 42.2k to 45.8k.
This would be the triangle and we saw this pattern many times recently.
If the history repeat itself, BTCUSDT price would go down and we can see the double bottom (28k ~ 30k).
This is not a financial advice :-)
This would be the triangle and we saw this pattern many times recently.
If the history repeat itself, BTCUSDT price would go down and we can see the double bottom (28k ~ 30k).
This is not a financial advice :-)
Related publications
Disclaimer
The information and publications are not meant to be, and do not constitute, financial, investment, trading, or other types of advice or recommendations supplied or endorsed by TradingView. Read more in the Terms of Use.
Related publications
Disclaimer
The information and publications are not meant to be, and do not constitute, financial, investment, trading, or other types of advice or recommendations supplied or endorsed by TradingView. Read more in the Terms of Use.