Full Analysis
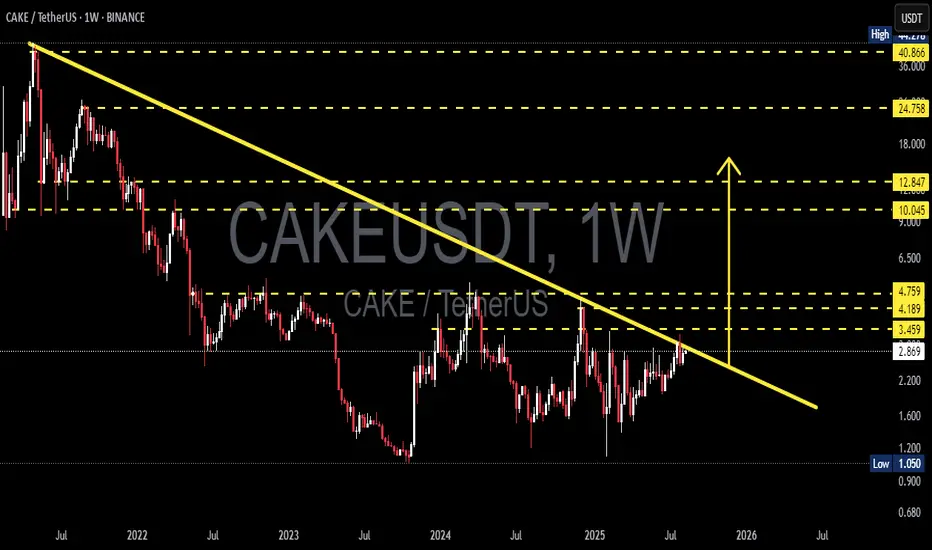
CAKE/USDT is now at one of the most critical points since the 2021 bear market began. Price is currently around $2.87, touching the multi-year downtrend line that has acted as a ceiling for more than three years.
From the chart, we can see:
📉 Downtrend Line: Originating from the 2021 all-time high, connecting multiple lower highs. It’s a major resistance that has never been broken since the decline started.
📊 Layered Resistance Zones: $3.46 → $4.19 → $4.76, followed by major resistances at $10.04 and $12.85.
📈 Strong Support Zones: $2.20 (minor support), $1.60, and the historical low at $1.05.
⏳ Consolidation Range: Since 2023, price has mostly moved sideways — potentially signaling quiet accumulation before a major move.
---
Pattern & Context
The current market structure shows:
1. Compression / Pressure Convergence: Downtrend line meets strong horizontal support → often a trigger for either a breakout or a sharp rejection.
2. Potential Breakout Setup: A weekly close above the trendline + key level $3.45–$3.50 could mark the start of a bullish reversal.
3. Bearish Continuation Risk: Failure to break out and a rejection from this zone could resume the long-term downtrend channel toward previous lows.
---
Bullish Scenario 🟢
Trigger: Weekly close above $3.50 + strong breakout volume.
Target 1: $4.19 → psychological and horizontal resistance.
Target 2: $4.76 → a historical supply zone.
Mid-term Target: $10.04 → a key historical resistance; breaking it could open the way to $12.85 and even $24.76 (in case of a strong market-wide bullish cycle).
Extra Confirmation: RSI > 55–60, MACD bullish cross on the weekly timeframe.
---
Bearish Scenario 🔴
Trigger: Rejection at the trendline + weekly close below $2.70.
Target 1: $2.20 → intra-range support.
Target 2: $1.60 → previous major support from 2022–2023.
Final Target: $1.05 → historical low, possible liquidity grab in a panic sell.
Extra Confirmation: Long upper wicks, increasing selling volume, RSI failing to cross above 50.
---
Strategy & Risk Management
Breakout Traders: Wait for a confirmed weekly close above $3.50 before entering, with stops below the swing low or trendline.
Rejection Traders: Look for false breakout signals at the trendline to short with targets at lower supports.
Position Sizing: Risk only 1–3% per trade.
Multi-TF Confirmation: Check daily and 4H charts to validate breakout/rejection setups.
---
Conclusion
📍 CAKE is at a make-or-break point — will this be the start of a major trend reversal or a continuation of the long-standing downtrend? Medium- and long-term traders should closely watch the weekly close this week.
🚨 A breakout here could reshape the entire trend map — but beware of potential fakeouts that are common at such key moments.
---
> CAKE/USDT is testing a multi-year downtrend line after 3 years of pressure. A weekly close above $3.50 could open the path to $4.19–$4.76, and even $10+. A rejection here risks a drop to $2.20 or $1.05. This could be the start of a major trend change — or the biggest trap of the year.
#CAKEUSDT #PancakeSwap #CryptoAnalysis #PriceAction #Breakout #TechnicalAnalysis #CryptoTrading #WeeklyChart #SupportResistance #TrendReversal #CryptoBreakout #DeFi
✅ Get Free Signals! Join Our Telegram Channel Here: t.me/TheCryptoNuclear
✅ Twitter: twitter.com/crypto_nuclear
✅ Join Bybit : partner.bybit.com/b/nuclearvip
✅ Benefits : Lifetime Trading Fee Discount -50%
✅ Twitter: twitter.com/crypto_nuclear
✅ Join Bybit : partner.bybit.com/b/nuclearvip
✅ Benefits : Lifetime Trading Fee Discount -50%
Disclaimer
The information and publications are not meant to be, and do not constitute, financial, investment, trading, or other types of advice or recommendations supplied or endorsed by TradingView. Read more in the Terms of Use.