CARR’s chart is showing some very interesting price action setups. Let’s break it down step by step, moving from the higher timeframe to the lower timeframe for better clarity.
📊 Weekly Timeframe Analysis
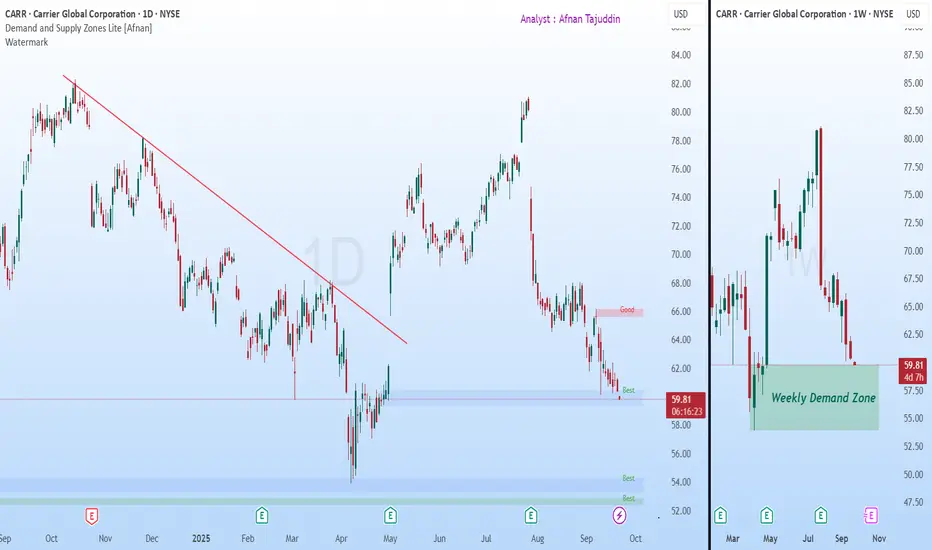
On the weekly chart, price has approached a fresh demand zone. This zone stands out because:
🔎 Daily Timeframe Confluence
When we move down to the daily chart, the picture becomes even more convincing:
🎯 Trading Plan Perspective 🎯
Currently, price is still trading inside the daily demand zone. This creates a potentially favorable risk-to-reward opportunity.
✨ Stay patient, follow your plan, and let the market come to you. 🚀
📊 Weekly Timeframe Analysis
On the weekly chart, price has approached a fresh demand zone. This zone stands out because:
- It was created by a very strong leg-out candle, showing institutional strength.
- The size and momentum of the move away from this level suggest it’s a high-quality zone.
🔎 Daily Timeframe Confluence
When we move down to the daily chart, the picture becomes even more convincing:
- Price has halted exactly at the daily demand zone.
- This daily zone is nested inside the weekly zone, giving a strong confluence.
- The formation candle of this daily demand zone was a sharp move up, confirming quality.
- The follow-through candle was a gap-up, showing aggressive buying interest.
- The follow-through candle from the daily demand zone has broken the downtrend trendline. This is a strong achievement of this zone, making it very good.
🎯 Trading Plan Perspective 🎯
Currently, price is still trading inside the daily demand zone. This creates a potentially favorable risk-to-reward opportunity.
- Wait for a clear sign of strength, such as a bullish candlestick pattern.
- Enter a long trade once confirmation is seen.
- Place your stop loss just below the demand zone.
- Target at least a 1:2 risk-to-reward ratio.
“Opportunities don’t come every day in trading, but when price aligns across timeframes, it’s worth paying close attention.”
✨ Stay patient, follow your plan, and let the market come to you. 🚀
Access the powerful Demand and Supply Zone Pro indicator at:
marketup2date.com
Stay updated on Telegram:
t.me/MarketUp2Date
Join our WhatsApp channel:
whatsapp.com/channel/0029Va6ByyH0LKZCc4Az4x0u
marketup2date.com
Stay updated on Telegram:
t.me/MarketUp2Date
Join our WhatsApp channel:
whatsapp.com/channel/0029Va6ByyH0LKZCc4Az4x0u
Related publications
Disclaimer
The information and publications are not meant to be, and do not constitute, financial, investment, trading, or other types of advice or recommendations supplied or endorsed by TradingView. Read more in the Terms of Use.