Weekly Technical Landscape
Price Context
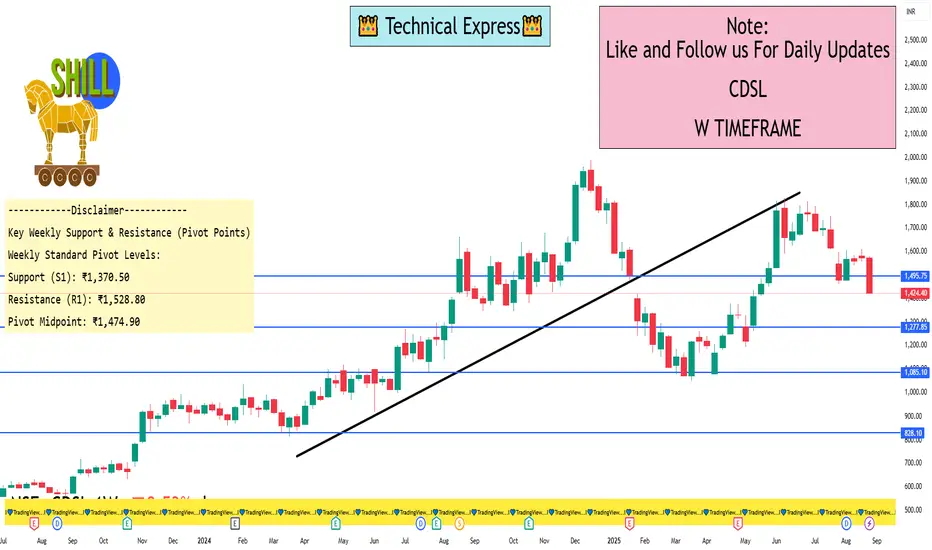
Current Price: Around ₹1,424–1,425 per share.
Performance: Down approximately 8–9% over the past week.
Technical Momentum
Technical Rating: Strong “Sell” on the daily; the weekly is “Sell,” with the monthly being neutral.
Trend: Strong bearish bias both short- and mid-term.
Key Weekly Support & Resistance (Pivot Points)
Weekly Standard Pivot Levels:
Support (S1): ₹1,370.50
Resistance (R1): ₹1,528.80
Pivot Midpoint: ₹1,474.90
MarketScreener Levels:
Short-term Resistance: ₹1,583.6
Support Zone: ₹1,367.4
Weekly View Summary & Outlook
Short-Term Weakness: The weekly technical setup remains bearish, with price under moving averages and selling signals dominating. The downward momentum could persist unless key resistances get decisively broken.
Critical Thresholds:
Hold above ₹1,370 may stabilize price temporarily.
A clear breakout above ₹1,475–1,528 could shift short-term sentiment.
Cautious Optimism (Alternate Scenario): If price forms and breaks out from a cup-and-handle pattern (between ₹1,631–1,834), that could indicate a potential reversal—but this is speculative and higher-risk.
Trading Considerations:
For bears: Short-term positions favored as long as price remains below pivot/resistance zones.
For bulls: Wait for stable hold above ₹1,475–1,528—or ideally, a confirmed breakout above ₹1,834—before considering entries.
Price Context
Current Price: Around ₹1,424–1,425 per share.
Performance: Down approximately 8–9% over the past week.
Technical Momentum
Technical Rating: Strong “Sell” on the daily; the weekly is “Sell,” with the monthly being neutral.
Trend: Strong bearish bias both short- and mid-term.
Key Weekly Support & Resistance (Pivot Points)
Weekly Standard Pivot Levels:
Support (S1): ₹1,370.50
Resistance (R1): ₹1,528.80
Pivot Midpoint: ₹1,474.90
MarketScreener Levels:
Short-term Resistance: ₹1,583.6
Support Zone: ₹1,367.4
Weekly View Summary & Outlook
Short-Term Weakness: The weekly technical setup remains bearish, with price under moving averages and selling signals dominating. The downward momentum could persist unless key resistances get decisively broken.
Critical Thresholds:
Hold above ₹1,370 may stabilize price temporarily.
A clear breakout above ₹1,475–1,528 could shift short-term sentiment.
Cautious Optimism (Alternate Scenario): If price forms and breaks out from a cup-and-handle pattern (between ₹1,631–1,834), that could indicate a potential reversal—but this is speculative and higher-risk.
Trading Considerations:
For bears: Short-term positions favored as long as price remains below pivot/resistance zones.
For bulls: Wait for stable hold above ₹1,475–1,528—or ideally, a confirmed breakout above ₹1,834—before considering entries.
I built a Buy & Sell Signal Indicator with 85% accuracy.
📈 Get access via DM or
WhatsApp: wa.link/d997q0
| Email: techncialexpress@gmail.com
| Script Coder | Trader | Investor | From India
📈 Get access via DM or
WhatsApp: wa.link/d997q0
| Email: techncialexpress@gmail.com
| Script Coder | Trader | Investor | From India
Related publications
Disclaimer
The information and publications are not meant to be, and do not constitute, financial, investment, trading, or other types of advice or recommendations supplied or endorsed by TradingView. Read more in the Terms of Use.