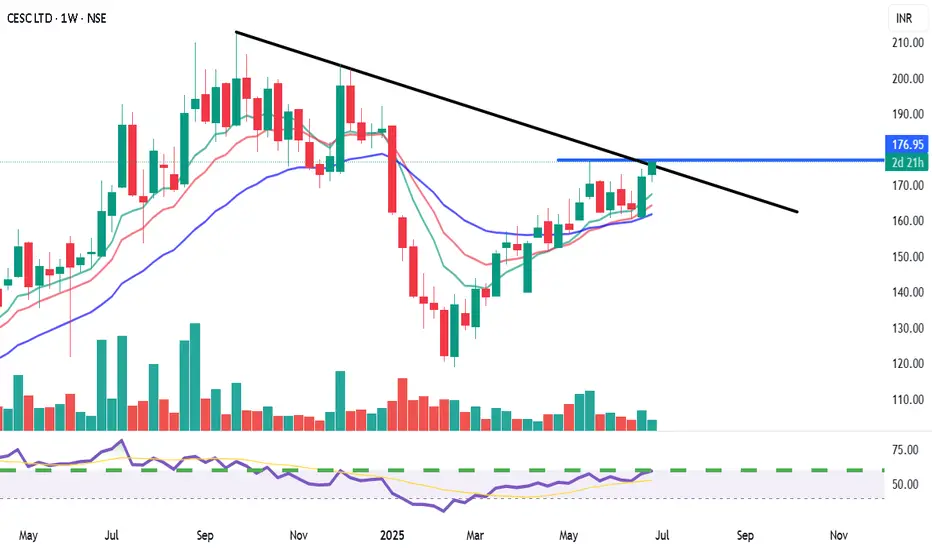
View: Bullish on confirmed breakout.
Bias: Positive momentum.
Strategy:
BUY: Above ₹178-180 (on weekly closing basis, confirming trendline and resistance breakout).
Targets (T):
T1: ₹195-200
T2: ₹210-220+
Stop-Loss (SL): ₹168 (on weekly closing basis).
Reasoning:
Attempting a breakout from a significant descending trendline.
Cleared horizontal resistance at ₹175.
Bullish crossover in moving averages with price above all MAs.
Strong RSI and supportive volume.
Potential for a major trend reversal.
Note: This is an educational analysis and not financial advice. Do your own due diligence before investing.
Disclaimer
The information and publications are not meant to be, and do not constitute, financial, investment, trading, or other types of advice or recommendations supplied or endorsed by TradingView. Read more in the Terms of Use.
Disclaimer
The information and publications are not meant to be, and do not constitute, financial, investment, trading, or other types of advice or recommendations supplied or endorsed by TradingView. Read more in the Terms of Use.