📊 Intraday Technical Levels (1-Day Timeframe)
🔹 Support Levels:
S1: ₹1,014.39
S2: ₹1,004.16
S3: ₹999.87
S4: ₹954.20
📈 Intraday Support & Resistance Levels
Type Support (S) Resistance (R)
Classic ₹1,025.60 ₹1,074.60
Camarilla ₹1,025.31 ₹1,043.28
Fibonacci ₹1,025.60 ₹1,074.60
Woodie's ₹1,054.30 ₹1,075.65
Demark ₹1,014.40 ₹1,063.40
🔍 Technical Indicators Snapshot
RSI (14): 60.08 – Indicates a mild uptrend.
Stochastic RSI: 0.76 – Suggests strong bullish momentum.
MACD: 5.66 – Positive, confirming upward momentum.
ADX: 37.47 – Indicates a strong trend.
CCI (14): 105.25 – Suggests strong bullish momentum.
EMA (20, 50, 100, 200): All above current price, supporting an uptrend.
Pivot Point: ₹1,025.60
Central Pivot Range (CPR): Top: ₹1,027.70, Bottom: ₹1,023.50
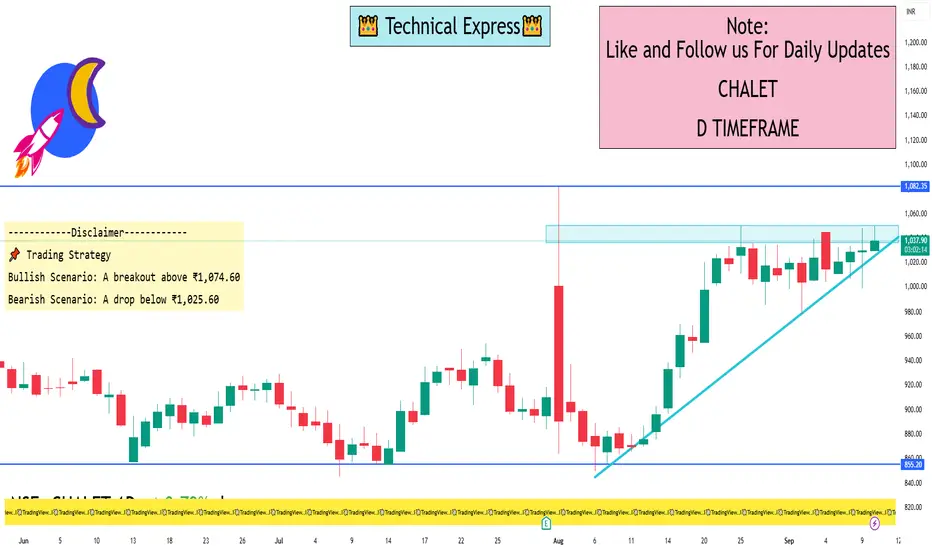
📌 Trading Strategy
Bullish Scenario: A breakout above ₹1,074.60 (R1) could target ₹1,100–₹1,120, with support at ₹1,025.60.
Bearish Scenario: A drop below ₹1,025.60 (pivot) may lead to ₹1,004.16 (S2), with resistance at ₹1,043.28.
🔹 Support Levels:
S1: ₹1,014.39
S2: ₹1,004.16
S3: ₹999.87
S4: ₹954.20
📈 Intraday Support & Resistance Levels
Type Support (S) Resistance (R)
Classic ₹1,025.60 ₹1,074.60
Camarilla ₹1,025.31 ₹1,043.28
Fibonacci ₹1,025.60 ₹1,074.60
Woodie's ₹1,054.30 ₹1,075.65
Demark ₹1,014.40 ₹1,063.40
🔍 Technical Indicators Snapshot
RSI (14): 60.08 – Indicates a mild uptrend.
Stochastic RSI: 0.76 – Suggests strong bullish momentum.
MACD: 5.66 – Positive, confirming upward momentum.
ADX: 37.47 – Indicates a strong trend.
CCI (14): 105.25 – Suggests strong bullish momentum.
EMA (20, 50, 100, 200): All above current price, supporting an uptrend.
Pivot Point: ₹1,025.60
Central Pivot Range (CPR): Top: ₹1,027.70, Bottom: ₹1,023.50
📌 Trading Strategy
Bullish Scenario: A breakout above ₹1,074.60 (R1) could target ₹1,100–₹1,120, with support at ₹1,025.60.
Bearish Scenario: A drop below ₹1,025.60 (pivot) may lead to ₹1,004.16 (S2), with resistance at ₹1,043.28.
I built a Buy & Sell Signal Indicator with 85% accuracy.
📈 Get access via DM or
WhatsApp: wa.link/d997q0
Contact - +91 76782 40962
| Email: techncialexpress@gmail.com
| Script Coder | Trader | Investor | From India
📈 Get access via DM or
WhatsApp: wa.link/d997q0
Contact - +91 76782 40962
| Email: techncialexpress@gmail.com
| Script Coder | Trader | Investor | From India
Related publications
Disclaimer
The information and publications are not meant to be, and do not constitute, financial, investment, trading, or other types of advice or recommendations supplied or endorsed by TradingView. Read more in the Terms of Use.