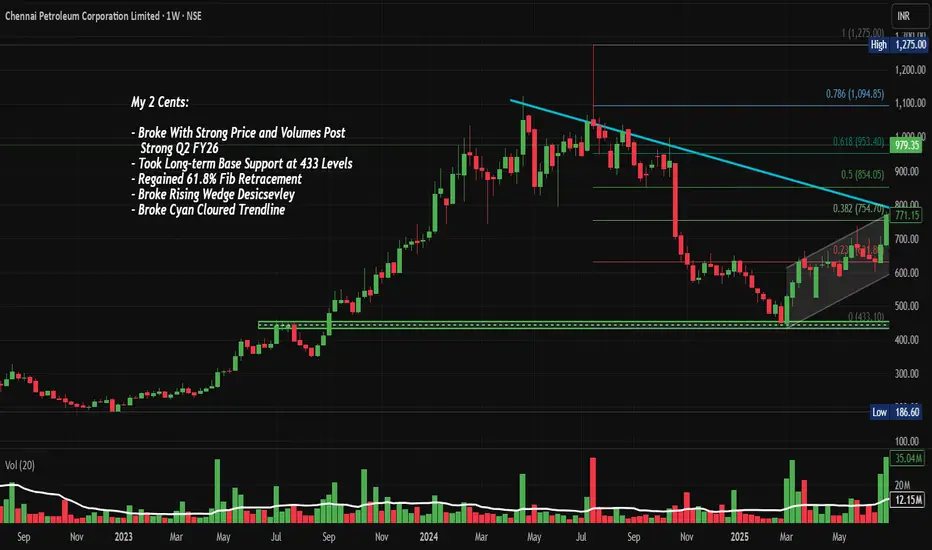
ChennaiPetro: Wedge & Trendline BO with 61.8%, Chart of the Week
As per the Latest SEBI Mandate, this isn't a Trading/Investment RECOMMENDATION nor for Educational Purposes; it is just for Informational purposes only. The chart data used is 3 Months old, as Showing Live Chart Data is not allowed according to the New SEBI Mandate.
Disclaimer: "I am not a SEBI REGISTERED RESEARCH ANALYST AND INVESTMENT ADVISER."
This analysis is intended solely for informational purposes and should not be interpreted as financial advice. It is advisable to consult a qualified financial advisor or conduct thorough research before making investment decisions.
Price Action Analysis:
Trend Structure and Momentum:
- The stock experienced a prolonged uptrend from March 2023 to July 2024, rallying from base levels around ₹433 to a peak of ₹1,275, representing approximately 195% appreciation
- Post the July 2024 peak, the stock entered a corrective phase characterised by lower highs and consolidation
- Recent price action shows a breakout above the descending cyan trendline that had been capping rallies since mid-2024
- Current price of ₹979.35 (as of October 31, 2025) represents a 26.80% gain, indicating strong buying momentum
- The stock is trading above all key Fibonacci retracement levels, having reclaimed the 61.8% level at approximately ₹953
Candlestick Patterns and Formations:
- The most recent candle shows a strong bullish close with a substantial body, indicating conviction in the upward move
- The chart displays a rising wedge/descending channel pattern that was broken decisively in recent sessions
- Prior consolidation between ₹700-₹850 formed a re-accumulation base, which has now been breached to the upside
- The breakout candle demonstrates strong price and volume expansion, a classic sign of institutional participation
Volume Spread Analysis:
Volume Characteristics:
- Recent volume surge to 90.39 million shares significantly exceeds the average volume of 13.46 million, representing approximately 6.7x normal trading activity
- The volume spike coincides with the price breakout, validating the move as genuine rather than a false breakout
- Historical volume analysis shows similar spikes during major trend reversals, particularly during the March 2023 base breakout
- Volume expansion without corresponding price weakness suggests strong demand absorption at current levels
Volume-Price Relationship:
- The volume profile indicates heavy accumulation in the ₹700-₹800 zone, which now serves as a critical support cluster
- Recent sessions show sustained above-average volume, suggesting institutional interest rather than retail speculation
- The volume pattern aligns with a classic "breakout with expansion" scenario, increasing the probability of trend continuation
Support and Resistance Levels:
Key Support Zones:
- Primary Support (S1): ₹854 - This represents the 0.5 Fibonacci retracement level and previous consolidation high
- Secondary Support (S2): ₹754 - The 0.382 Fibonacci level and recent breakout point from the descending trendline
- Critical Support (S3): ₹631 - The 0.236 Fibonacci level and long-term base support at ₹433-₹450 zone
- The grey trendline originating from the 2024 lows provides dynamic support, currently positioned around ₹720
Key Resistance Zones:
- Immediate Resistance (R1): ₹1,094 - The 0.786 Fibonacci retracement level
- Major Resistance (R2): ₹1,275 - The all-time high achieved in July 2024 and psychological resistance
- Extended Resistance (R3): ₹1,400-₹1,500 - Projected based on measured move from the consolidation range
Technical Patterns and Indicators:
Chart Patterns:
- Descending Channel Breakout: The stock has successfully breached the cyan-colored descending trendline that acted as resistance since July 2024
- Rising Wedge Resolution: The consolidation pattern between August and October 2025 has resolved to the upside
- Base-on-Base Formation: The ₹433 level established in early 2024 served as the foundation for the subsequent rally, demonstrating strong long-term base support
- Cup and Handle (Potential): If the stock consolidates between ₹950-₹1,050 and then breaks out, it could form a cup and handle pattern projecting toward ₹1,400+
Fibonacci Analysis:
- The 61.8% Fibonacci retracement at ₹953 has been convincingly reclaimed, suggesting the corrective phase may be complete
- Golden ratio support held perfectly during the September-October consolidation
- The next Fibonacci target at 0.786 (₹1,094) represents the immediate upside objective
- Fibonacci extension levels project Upmove at ₹1,350 (1.272 extension) and ₹1,500 (1.618 extension) if the rally extends
Risk Factors and Invalidation Levels:
- A close below ₹920 would signal a potential false breakout
- Sustained trading below ₹850 would invalidate the bullish setup and suggest resumption of the downtrend
- Weekly close below the broken trendline (currently around ₹940) would be a bearish reversal signal
- Failure to maintain above 61.8% Fibonacci retracement could trigger another corrective leg
Fundamental and Sectoral Backdrop:
Company Fundamentals:
- Chennai Petroleum Corporation (CPCL) reported Q2 FY26 revenue of ₹16,327 crore with profit after tax of ₹719 crore
- The company achieved a crude throughput of 3.013 million metric tonnes (MMT) with a Gross Refining Margin (GRM) of $9.04 per barrel in Q2 FY26
- However, Q1 FY26 saw challenges with a net loss of ₹40 crore compared to a profit of ₹357 crore in Q1 FY25, primarily due to inventory losses and lower GRM of $3.22 per barrel
- For H1 FY26, CPCL recorded net profit of ₹689.68 crore versus a net loss of ₹294.45 crore in H1 FY25, with average GRM at $6.17 per barrel
- The company achieved a record crude throughput of 11.642 MMT with 111% capacity utilisation
Business Operations and Product Portfolio:
- CPCL is engaged in refining crude oil to produce various petroleum products, including LPG, Motor Spirit, Kerosene, Aviation Turbine Fuel, High Speed Diesel, Naphtha, Fuel Oil, and Bitumen
- The company also produces speciality products like Paraffin Wax, Mineral Turpentine Oil, Hexane, and Petrochemical feedstocks
- Most fuel products are marketed by the parent company, Indian Oil Corporation (IOC), while CPCL directly markets speciality products
- In 2024, CPCL commissioned new infrastructure, including Pharma Grade Hexane production and Sustainable Aviation Fuel
Financial Metrics and Valuation:
- Market capitalisation stands at approximately ₹14,584 crore, with the company maintaining a healthy dividend payout of 35%
- CPCL has demonstrated strong return on equity with a 3-year ROE of 31% and has reduced debt levels
- Current price-to-earnings and other valuation metrics suggest the stock is reasonably valued considering sectoral challenges
Sector Outlook and Industry Trends:
- India's refining capacity increased to 258.1 MMTPA as of FY25, with domestic consumption at 239.2 MMTPA
- India is expected to drive global oil demand growth, with consumption projected at 5.74 million barrels per day in 2025 and 5.99 million bpd in 2026
- The country plans to expand refining capacity to 309.5 MMTPA by 2028
- Refinery output has been strong, with manufacturing IIP for refined petroleum products rising 4.24% in June 2025, driven by auto-fuel demand growth of 7.9% year-on-year
- However, refining margins are expected to fall below mid-cycle levels in FY25, indicating potential profitability challenges
Opportunities and Challenges:
Opportunities:
- Downstream activities driven by refinery-petrochemical integration are projected to post the highest 5.2% CAGR through 2030
- Growing domestic demand for petroleum products with urbanisation and economic growth
- Government initiatives supporting energy infrastructure development
- Indian refiners have benefited from processing discounted Russian crude, generating significant margins
Challenges:
- Net profit declined for the last two quarters, with an average decrease of 108.5% per quarter, and revenue fell 14.1% per quarter
- Volatile crude oil prices and fluctuating gross refining margins
- India's domestic crude oil production has fallen 26.3% and natural gas by 24.1% during FY12-FY25, leading to increased import dependency
- Environmental regulations and pressure to transition toward cleaner energy
- Institutional investment in CPCL decreased by 37.83% over the past 30 days
Competitive Position:
- CPCL is a subsidiary of Indian Oil Corporation, providing strategic advantages in product marketing and distribution
- The company competes with major refiners, including Reliance Industries, Bharat Petroleum, Hindustan Petroleum, and Mangalore Refinery
- CPCL's core vision is to be the most admired Indian energy company, creating value through world-class performance and ethical governance
- The company's location in South India provides strategic advantages for serving the region's growing energy needs
Fundamental Risks:
- The stock trades at reasonable valuations with potential upside to fair value estimates around ₹1,050
- Strong Q2 performance suggests earnings momentum is improving after a weak Q1
- Sectoral tailwinds from growing domestic demand support medium-term prospects
- Key risks include GRM volatility, crude price fluctuations, and regulatory changes
My 2 Cents:
- CPCL presents a compelling technical setup following the breakout from a multi-month consolidation pattern
- The combination of volume expansion, Fibonacci support, and trendline breach suggests potential for further upside
- Risk management is critical given sectoral volatility; strict adherence to stop losses is recommended
Full Coverage on my Newsletter this Week
Keep in the Watchlist and DOYR.
NO RECO. For Buy/Sell.
📌Thank you for exploring my idea! I hope you found it valuable.
🙏FOLLOW for more
👍BOOST if you found it useful.
✍️COMMENT below with your views.
Meanwhile, check out my other stock ideas on the right side until this trade is activated. I would love your feedback.
As per the Latest SEBI Mandate, this isn't a Trading/Investment RECOMMENDATION nor for Educational Purposes; it is just for Informational purposes only. The chart data used is 3 Months old, as Showing Live Chart Data is not allowed according to the New SEBI Mandate.
Disclaimer: "I am not a SEBI REGISTERED RESEARCH ANALYST AND INVESTMENT ADVISER."
This analysis is intended solely for informational purposes and should not be interpreted as financial advice. It is advisable to consult a qualified financial advisor or conduct thorough research before making investment decisions.
Related publications
Disclaimer
The information and publications are not meant to be, and do not constitute, financial, investment, trading, or other types of advice or recommendations supplied or endorsed by TradingView. Read more in the Terms of Use.
Related publications
Disclaimer
The information and publications are not meant to be, and do not constitute, financial, investment, trading, or other types of advice or recommendations supplied or endorsed by TradingView. Read more in the Terms of Use.