Price Action:
Price Movement Characteristics:
- Volatility: Compressed volatility within the Darvas Box range
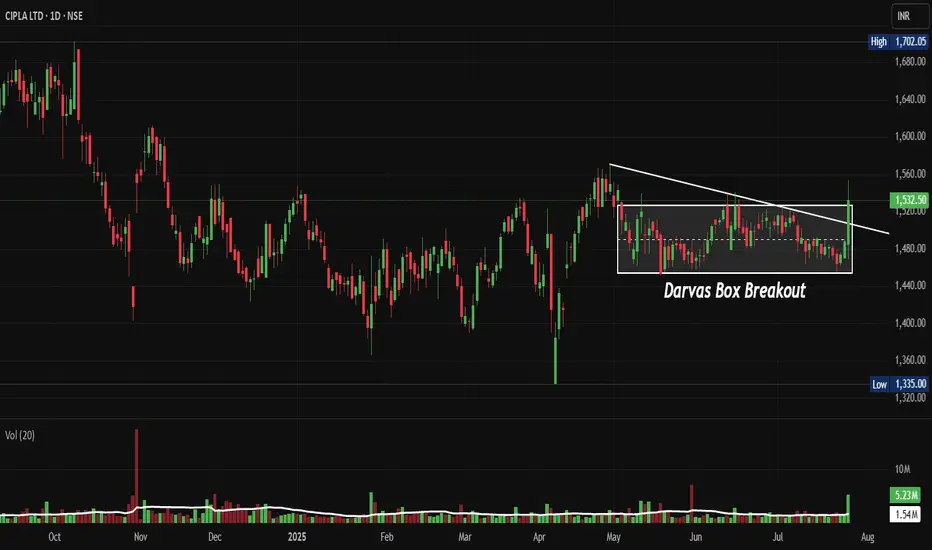
- Price Swings: Controlled swings between ₹1,480-1,532.50 boundaries
- Breakout Attempts: Multiple tests of upper resistance without sustained follow-through
- Support Tests: Clean bounces from the lower boundary showing strong institutional support
Volume Spread Analysis
- Current Volume: 5.23M (above 20-day average)
- Volume Pattern: Declining during consolidation (bullish accumulation sign)
- Volume Spike Required: Need 1.5x average volume for breakout confirmation
- Volume Trend: Steady participation without panic selling
Market Structure Analysis:
- Higher Lows Formation: Gradual increase in swing lows within the consolidation
- Lower Highs Compression: Resistance level holding firm, creating compression
- Price Coiling: Decreasing range suggesting energy buildup for directional move
- Time Compression: Extended sideways movement indicating a major move is pending
Chart Pattern Recognition:
- Primary Pattern: Darvas Box Formation (clearly marked on the chart)
- Box Range: ₹1,480 - ₹1,532.50 consolidation zone
- Pattern Duration: Approximately 3-4 months of sideways consolidation
- Volume Context: Declining volume during the consolidation phase, typical of accumulation
Candlestick Pattern Analysis:
- Recent Candles Formation: Doji and small-bodied candles indicating indecision at resistance
- Candle Bodies: Predominantly small bodies suggesting balanced buying/selling pressure
- Wicks Analysis: Upper wicks at resistance showing selling pressure, lower wicks showing support
- Colour Distribution: Mixed red/green candles within the box showing consolidation
Key Support and Resistance Levels:
- Immediate Support: ₹1,480 (Darvas Box lower boundary)
- Strong Support: ₹1,420 (previous swing low)
- Critical Support: ₹1,335 (yearly low)
- Immediate Resistance: ₹1,532.50 (Darvas Box upper boundary)
- Target Resistance: ₹1,600-1,620 (measured move projection)
- Ultimate Target: ₹1,700+ (analyst consensus target)
Base Formation:
- Base Type: Rectangular consolidation/Darvas Box
- Base Duration: 3-4 months (adequate for institutional accumulation)
- Base Tightness: Well-defined boundaries showing controlled supply
- Breakout Confirmation: Price action at upper boundary with volume expansion needed
Trend Analysis:
- Short-term Trend: Sideways consolidation
- Medium-term Trend: Neutral to slightly bullish
- Long-term Trend: Recovery phase from 2024 lows
Momentum Indicators:
- Current Momentum: Building up for potential breakout
- Price Position: Near upper boundary of consolidation range
- Market Structure: Higher lows formation within the box
Trade Setup Strategy:
Entry Strategy:
- Primary Entry: Breakout above ₹1,535 with volume confirmation
- Secondary Entry: Retest of breakout level around ₹1,520-1,525
- Conservative Entry: Support bounce from ₹1,485-1,490
Target Levels:
- Target 1: ₹1,580 (initial resistance)
- Target 2: ₹1,620 (measured move from box height)
- Target 3: ₹1,700 (analyst target consensus)
- Long-term Target: ₹1,800+ (bull case scenario)
Stop-Loss Levels:
- Aggressive: ₹1,470 (below box support)
- Conservative: ₹1,450 (below key support zone)
- Risk Management: ₹1,420 (major support failure)
Position Sizing Guidelines:
- High Conviction: 2-3% of portfolio (on confirmed breakout)
- Medium Conviction: 1-2% of portfolio (on retest entry)
- Conservative: 0.5-1% of portfolio (support bounce play)
- Maximum Risk per Trade: Not more than 1% of total capital
Risk Management Framework:
- Risk-Reward Ratio: Minimum 1:2 for all entries
- Position Scaling: Add on strength after initial 5% move
- Profit Booking: Book 30% at Target 1, 40% at Target 2, trail rest
- Stop-Loss Management: Trail stop to breakeven after 7-8% profit
Sectoral and Fundamental Backdrop:
Pharmaceutical Sector Outlook:
- Market Size: The Indian pharma market is expected to reach US$18.8 billion by 2028 at an 8% CAGR
- Global Position: 500 facilities approved by the US FDA, the highest number outside the US
- Growth Drivers: Speedy introduction of generic drugs and focus on rural health programmes
CIPLA Fundamental Strengths:
- Market Capitalization: ₹1,23,842 Crore
- Performance: ₹27,548 Cr revenue with ₹5,269 Cr profit
Key Fundamental Concerns:
- Growth Rate: Poor sales growth of 10% over the past five years
- Promoter Holding: Decreased by 4.42% over the last 3 years, currently at 29.19%
Industry Catalysts:
- FDA Approvals: India has received 6,316 USFDA approvals for formulation plants
- Global Market Share: India supplies 40 per cent of generic drugs globally
- Export Potential: Strong positioning as a global generic supplier
Risk Assessment:
Technical Risks:
- Pattern Failure: Box breakdown below ₹1,470 would negate the bullish thesis
- Volume Concerns: Breakout without volume confirmation could lead to a false move
- Market Sentiment: Broader market correction could impact individual stock performance
Fundamental Risks:
- Regulatory Changes: FDA compliance issues or policy changes
- Competition: Intense pricing pressure in the generic segment
- Currency Risk: Rupee fluctuation impact on export revenues
Market Risks:
- Sector Rotation: Money flow away from the pharma sector
- Global Slowdown: Impact on export-dependent business model
- Geopolitical Factors: Trade tensions affecting pharmaceutical exports
My Take:
Trading/Investment Thesis:
The Darvas Box pattern on
My Action Plan:
- Watch for breakout above ₹1,535 with 1.5x volume
- Enter in phases rather than a lump-sum investment
- Maintain strict stop-loss discipline
- Book profits in tranches as targets are achieved
Keep in the Watchlist and DOYR.
NO RECO. For Buy/Sell.
📌Thank you for exploring my idea! I hope you found it valuable.
🙏FOLLOW for more
👍BOOST if you found it useful.
✍️COMMENT below with your views.
Meanwhile, check out my other stock ideas on the right side until this trade is activated. I would love your feedback.
Disclaimer: "I am not a SEBI REGISTERED RESEARCH ANALYST AND INVESTMENT ADVISER."
This analysis is intended solely for informational and educational purposes and should not be interpreted as financial advice. It is advisable to consult a qualified financial advisor or conduct thorough research before making investment decisions.
Related publications
Disclaimer
The information and publications are not meant to be, and do not constitute, financial, investment, trading, or other types of advice or recommendations supplied or endorsed by TradingView. Read more in the Terms of Use.
Related publications
Disclaimer
The information and publications are not meant to be, and do not constitute, financial, investment, trading, or other types of advice or recommendations supplied or endorsed by TradingView. Read more in the Terms of Use.