📊 COLPAL – Technical & Educational Snapshot
Ticker: NSE: COLPAL | Sector: 🪥 FMCG
CMP: ₹[Insert CMP] ▲ (as of 20 Aug 2025)
Rating (for learning purpose): ⭐⭐⭐⭐
Pattern Observed: 📈 RSI Breakout + Bollinger Band Breakout
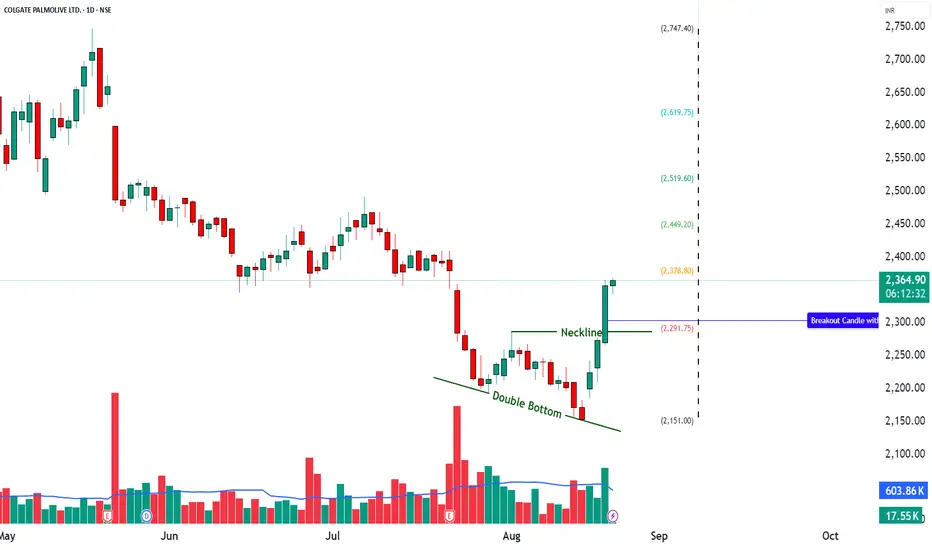
COLPAL is showing strong bullish momentum supported by multiple technical indicators. The presence of a strong bullish candle, along with an RSI breakout at 61, highlights healthy buying pressure. A Bollinger Band breakout and BB Squeeze-Off indicate rising volatility and the possibility of a continuation move. The Bullish SuperTrend adds further confirmation, while momentum indicators (MACD bullish, CCI at 223, Stochastic at 96) signal strong near-term strength.
📊 Momentum Snapshot: Momentum indicators are aligned on the bullish side. While Stochastic shows overbought conditions, strong volume-backed momentum often sustains until key resistance levels are tested.
📊 Volume Check:
🔹 Current Volume: 1.01M
🔹 20SMA Volume: 710.56k ✅
💥 Significantly above average – confirms strong institutional / broad-based buying interest!
💡 Interpretation:
When volume is well above the 20-period average, it strengthens the reliability of a breakout.
It shows that the move is not just retail-driven but likely supported by larger participants.
Breakouts with high volume tend to sustain better compared to low-volume moves.
💡 Learnings:
Breakouts with Bollinger Band expansion often lead to strong follow-through moves.
RSI + MACD confirmation together strengthen trend reliability.
High CCI & Stochastic values show strong momentum but also highlight the importance of monitoring for pullbacks.
Defining pullback and invalidation levels helps in disciplined trade management.
Key Levels:
Resistance: 2393 | 2429 | 2492
Support: 2293 | 2229 | 2193
Pullback Area: 2294
Invalidation Level: Close below 2193
STWP Trade Setup:
Entry (Long): Above 2365
Stop Loss: 2262 or below
Reference Levels: 2467 | 2569
⚠️ Disclaimer – Please Read Carefully
The information shared here is meant purely for learning and awareness. It is not a buy or sell recommendation and should not be taken as investment advice. I am not a SEBI-registered investment advisor, and all views expressed are based on personal study, chart patterns, and publicly available market data.
Trading — whether in stocks or options — carries risk. Markets can move unexpectedly, and losses can sometimes be larger than the money you have invested. Past performance or past setups do not guarantee future results.
If you are a beginner, treat this as a guide to understand how the market works — practice on paper trades before risking real money. If you are an experienced trader, remember to assess your own risk, position sizing, and strategy suitability before entering any trade.
Consult a SEBI-registered financial advisor before making any real trading decision.
By reading, watching, or engaging with this content, you acknowledge that you take full responsibility for your own trades and investments.
💬 Found this useful?
🔼 Give this post a Boost to help more traders discover clean, structured learning.
✍️ Drop your thoughts, questions, or setups in the comments — let’s grow together!
🔁 Share with fellow traders and beginners to spread awareness.
✅ Follow simpletradewithpatience for beginner-friendly setups, price action insights & disciplined trading content.
🚀 Stay Calm. Stay Clean. Trade With Patience.
Trade Smart | Learn Zones | Be Self-Reliant 📊
Ticker: NSE: COLPAL | Sector: 🪥 FMCG
CMP: ₹[Insert CMP] ▲ (as of 20 Aug 2025)
Rating (for learning purpose): ⭐⭐⭐⭐
Pattern Observed: 📈 RSI Breakout + Bollinger Band Breakout
COLPAL is showing strong bullish momentum supported by multiple technical indicators. The presence of a strong bullish candle, along with an RSI breakout at 61, highlights healthy buying pressure. A Bollinger Band breakout and BB Squeeze-Off indicate rising volatility and the possibility of a continuation move. The Bullish SuperTrend adds further confirmation, while momentum indicators (MACD bullish, CCI at 223, Stochastic at 96) signal strong near-term strength.
📊 Momentum Snapshot: Momentum indicators are aligned on the bullish side. While Stochastic shows overbought conditions, strong volume-backed momentum often sustains until key resistance levels are tested.
📊 Volume Check:
🔹 Current Volume: 1.01M
🔹 20SMA Volume: 710.56k ✅
💥 Significantly above average – confirms strong institutional / broad-based buying interest!
💡 Interpretation:
When volume is well above the 20-period average, it strengthens the reliability of a breakout.
It shows that the move is not just retail-driven but likely supported by larger participants.
Breakouts with high volume tend to sustain better compared to low-volume moves.
💡 Learnings:
Breakouts with Bollinger Band expansion often lead to strong follow-through moves.
RSI + MACD confirmation together strengthen trend reliability.
High CCI & Stochastic values show strong momentum but also highlight the importance of monitoring for pullbacks.
Defining pullback and invalidation levels helps in disciplined trade management.
Key Levels:
Resistance: 2393 | 2429 | 2492
Support: 2293 | 2229 | 2193
Pullback Area: 2294
Invalidation Level: Close below 2193
STWP Trade Setup:
Entry (Long): Above 2365
Stop Loss: 2262 or below
Reference Levels: 2467 | 2569
⚠️ Disclaimer – Please Read Carefully
The information shared here is meant purely for learning and awareness. It is not a buy or sell recommendation and should not be taken as investment advice. I am not a SEBI-registered investment advisor, and all views expressed are based on personal study, chart patterns, and publicly available market data.
Trading — whether in stocks or options — carries risk. Markets can move unexpectedly, and losses can sometimes be larger than the money you have invested. Past performance or past setups do not guarantee future results.
If you are a beginner, treat this as a guide to understand how the market works — practice on paper trades before risking real money. If you are an experienced trader, remember to assess your own risk, position sizing, and strategy suitability before entering any trade.
Consult a SEBI-registered financial advisor before making any real trading decision.
By reading, watching, or engaging with this content, you acknowledge that you take full responsibility for your own trades and investments.
💬 Found this useful?
🔼 Give this post a Boost to help more traders discover clean, structured learning.
✍️ Drop your thoughts, questions, or setups in the comments — let’s grow together!
🔁 Share with fellow traders and beginners to spread awareness.
✅ Follow simpletradewithpatience for beginner-friendly setups, price action insights & disciplined trading content.
🚀 Stay Calm. Stay Clean. Trade With Patience.
Trade Smart | Learn Zones | Be Self-Reliant 📊
STWP | Mentor & Demand-Supply Specialist | Empowering traders through structured learning |
simpletradewithpatience.com
Community: chat.whatsapp.com/BEYz0tkqP0fJPBCWf59uel
wa.me/message/6IOPHGOXMGZ4N1
Educational Only
simpletradewithpatience.com
Community: chat.whatsapp.com/BEYz0tkqP0fJPBCWf59uel
wa.me/message/6IOPHGOXMGZ4N1
Educational Only
Disclaimer
The information and publications are not meant to be, and do not constitute, financial, investment, trading, or other types of advice or recommendations supplied or endorsed by TradingView. Read more in the Terms of Use.