Crompton 52-Week Low Reversal Setup – Oversold Swing Trade
1. Price Action
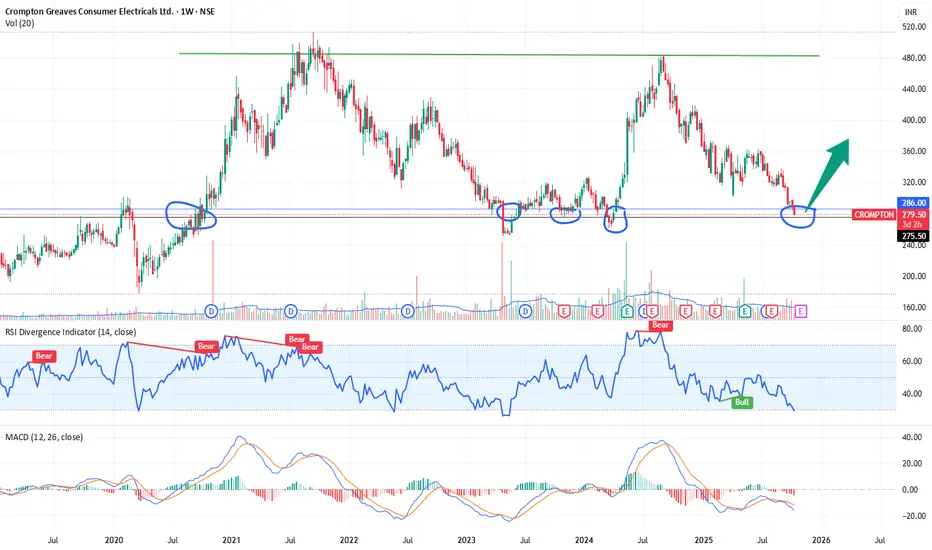
The stock is trading around ₹279–₹286, which is exactly at its 52-week low and a historical support zone from mid-2022.
Previous rebounds from this same area have led to 30–40% upside swings, indicating it’s a well-tested demand zone.
2. RSI (Relative Strength Index)
RSI at 23.8 → clearly oversold, near the lower extreme of its historical range.
In past instances (see mid-2022, mid-2023), RSI below 30 at this price level resulted in strong upward bounces — a potential bullish divergence may soon form.
3. MACD
MACD lines are deeply negative and starting to flatten out, which often precedes a momentum reversal.
If the MACD signal line crosses upward, that could confirm the beginning of a bullish swing.
4. Volume
The recent decline shows moderate-to-low volume, suggesting selling exhaustion rather than aggressive breakdown pressure.
5. Support and Resistance
Immediate support: ₹275–₹278 (current zone).
Upside swing targets: ₹305 → ₹325 → ₹350 (previous resistance and Fibonacci retracement zones).
Stop-loss: Below ₹272 (daily close).
Confirmation to Watch For
Bullish candle with volume > average on daily chart.
RSI rising above 30.
MACD crossover confirmation.
Price closing back above ₹285–₹290 (key trigger zone).
Note: This chart is for study and educational purposes only. Not a trade recommendation. Please do your own research and risk assessment before taking any position.
Disclaimer
The information and publications are not meant to be, and do not constitute, financial, investment, trading, or other types of advice or recommendations supplied or endorsed by TradingView. Read more in the Terms of Use.
Disclaimer
The information and publications are not meant to be, and do not constitute, financial, investment, trading, or other types of advice or recommendations supplied or endorsed by TradingView. Read more in the Terms of Use.