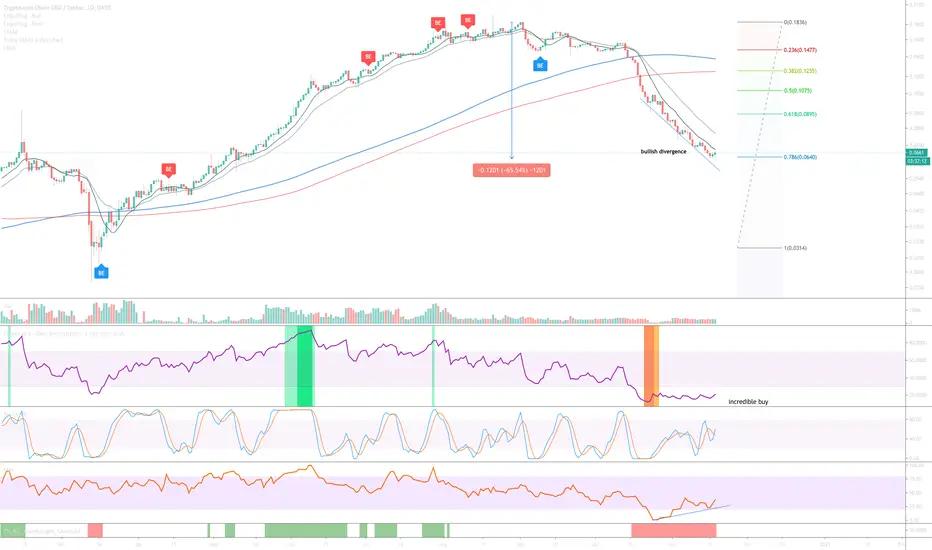
Following a 65% correction and oversold condition (orange column) the above 1-day chart is now showing a number of bullish indicators that a reversal is imminent. The facts:
1) Bullish divergence between price action and Money Flow.
2) Price action has retraced to the golden ratio, the 0.786.
4-day chart below is printing a Dragonfly DOJI however we can’t confirm until the next candle is printed. Nonetheless, we have a oversold condition.
Good luck!

1) Bullish divergence between price action and Money Flow.
2) Price action has retraced to the golden ratio, the 0.786.
4-day chart below is printing a Dragonfly DOJI however we can’t confirm until the next candle is printed. Nonetheless, we have a oversold condition.
Good luck!
Trade active
Note
2-day chart just printed a new candle showing a lot of momentum + increased volume. The days / weeks ahead should be interesting.Note
Some very mixed signals on the 3-day chart. Bearish engulfing whilst oversold. Feels like a 50/50 in terms of probability of direction right now - I don't like it.If current support is further weakened by sellers there's a 40% fall to the next support level.
I'm leaving the idea opened for the time being as my strategy confirms and remains an incredible buy, but the bottom might not yet be in. If you're a fan of this project I'd use the opportunity as dollar cost average in moment.
Trade closed: stop reached
Failed support on the 3-day chart opening the door to a test of the next support level, which could be -40% away.Trade active
Seems price found support, just not as low as expected.Trade closed manually
1500% gain. Awesome. Expect a 50-70% correction.Disclaimer
The information and publications are not meant to be, and do not constitute, financial, investment, trading, or other types of advice or recommendations supplied or endorsed by TradingView. Read more in the Terms of Use.
Disclaimer
The information and publications are not meant to be, and do not constitute, financial, investment, trading, or other types of advice or recommendations supplied or endorsed by TradingView. Read more in the Terms of Use.