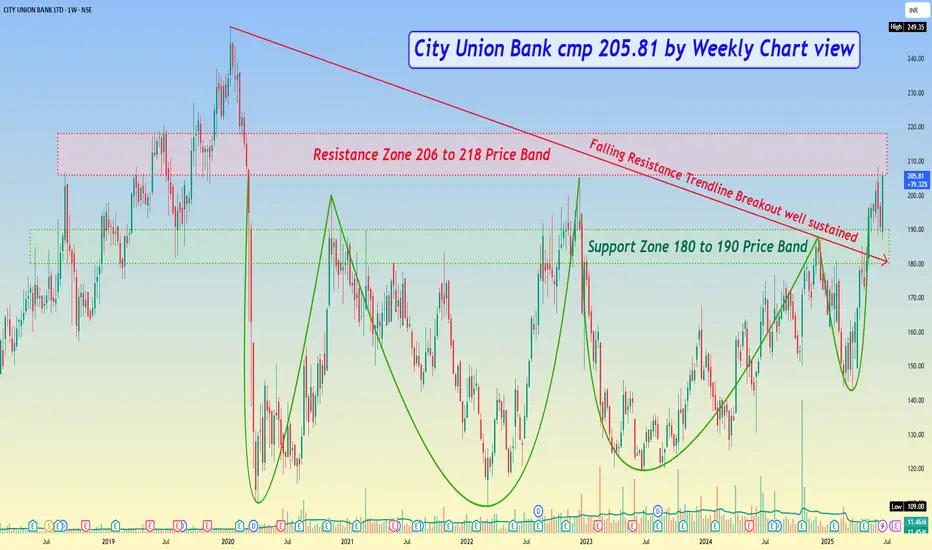
*City Union Bank cmp 205.81 by Weekly Chart view*
- Support Zone 180 to 190 Price Band
- Resistance Zone 206 to 218 Price Band
- Falling Resistance Trendline Breakout well sustained
- Technical Indicators of EMA, MACD, RSI on positive trend
- Repeated Bullish Rounding Bottoms with considerate Cup & Handle
- *Resistance Zone neckline acting as good hurdle to cross since breakdown in March 2020*
Disclaimer
The information and publications are not meant to be, and do not constitute, financial, investment, trading, or other types of advice or recommendations supplied or endorsed by TradingView. Read more in the Terms of Use.
Disclaimer
The information and publications are not meant to be, and do not constitute, financial, investment, trading, or other types of advice or recommendations supplied or endorsed by TradingView. Read more in the Terms of Use.