1. Market Condition
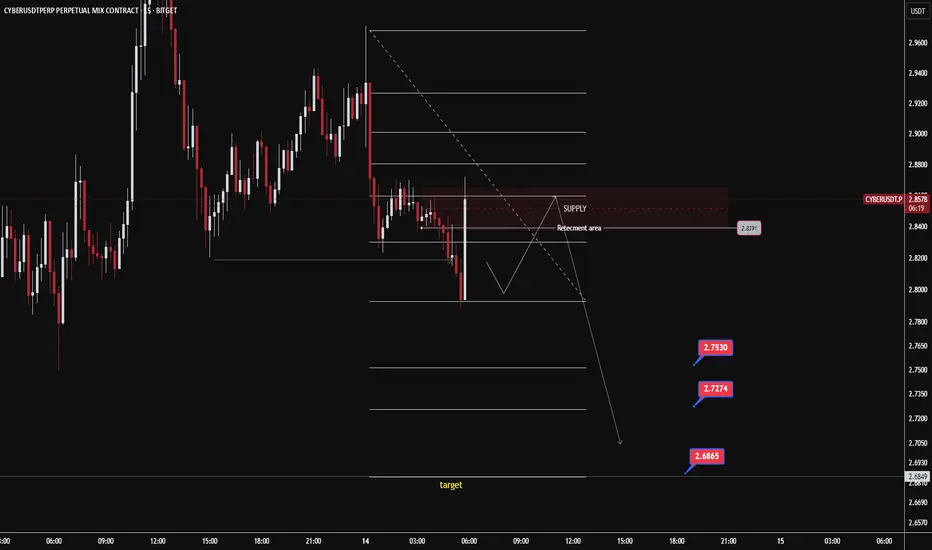
The market is currently in a downtrend on the 15-minute timeframe. Price has just broken below a minor support level and is moving toward a temporary demand area before a potential retest of the supply zone (around 2.8391). The structure is still forming lower highs and lower lows, indicating seller dominance.
2. Decision-Making Approach
Primary Scenario: Wait for price to retrace toward the supply/retracement zone (around 2.83–2.84) to look for sell opportunities in line with the prevailing trend.
Confirmation: Look for rejection or reversal candlestick patterns in the supply zone before entering.
Targets: As marked on the chart, potential take-profit levels are around 2.7530, 2.7274, and 2.6865.
Stop Loss: Place just above the supply zone to manage risk effectively.
3. Chart Explanation
Fibonacci Retracement & Extension: Used to measure potential pullback levels and the next downside targets.
Supply Zone: The red area above indicates a potential seller re-entry zone.
Arrows & Price Path: Illustrates the expected movement — pullback to supply followed by a drop toward the targets.
Price Labels: 2.7530, 2.7274, and 2.6865 are projected downside targets based on technical analysis.
Disclaimer
The information and publications are not meant to be, and do not constitute, financial, investment, trading, or other types of advice or recommendations supplied or endorsed by TradingView. Read more in the Terms of Use.
Disclaimer
The information and publications are not meant to be, and do not constitute, financial, investment, trading, or other types of advice or recommendations supplied or endorsed by TradingView. Read more in the Terms of Use.