DABUR INDIA LTD (NSE: DABUR) | Triangle Breakout with Volume Surge
Daily Chart Analysis | July 7, 2025
Technical Highlights:
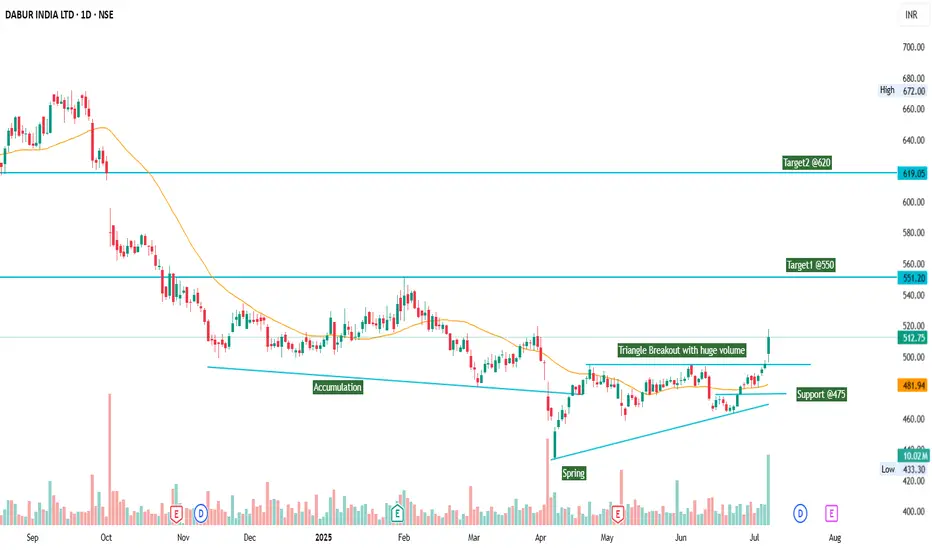
🔹 Accumulation Zone followed by a classic Spring — indicating smart money entry.
🔹 Symmetrical Triangle Formation observed over the last few months.
🔹 Today’s strong breakout candle on high volume confirms a bullish breakout from the triangle.
🔹 Immediate support at ₹475.
🔹 Price is now trading above the 30-day SMA — trend reversal confirmation.
Target Projections:
🎯 Target 1: ₹550
🎯 Target 2: ₹620
This setup offers a favorable risk-to-reward opportunity for swing traders. Watch for sustained volume and follow-through price action in Lower time frame (1Hr).
💡 Disclaimer: This is not financial advice. Please do your own analysis before investing.
Daily Chart Analysis | July 7, 2025
Technical Highlights:
🔹 Accumulation Zone followed by a classic Spring — indicating smart money entry.
🔹 Symmetrical Triangle Formation observed over the last few months.
🔹 Today’s strong breakout candle on high volume confirms a bullish breakout from the triangle.
🔹 Immediate support at ₹475.
🔹 Price is now trading above the 30-day SMA — trend reversal confirmation.
Target Projections:
🎯 Target 1: ₹550
🎯 Target 2: ₹620
This setup offers a favorable risk-to-reward opportunity for swing traders. Watch for sustained volume and follow-through price action in Lower time frame (1Hr).
💡 Disclaimer: This is not financial advice. Please do your own analysis before investing.
Disclaimer
The information and publications are not meant to be, and do not constitute, financial, investment, trading, or other types of advice or recommendations supplied or endorsed by TradingView. Read more in the Terms of Use.
Disclaimer
The information and publications are not meant to be, and do not constitute, financial, investment, trading, or other types of advice or recommendations supplied or endorsed by TradingView. Read more in the Terms of Use.