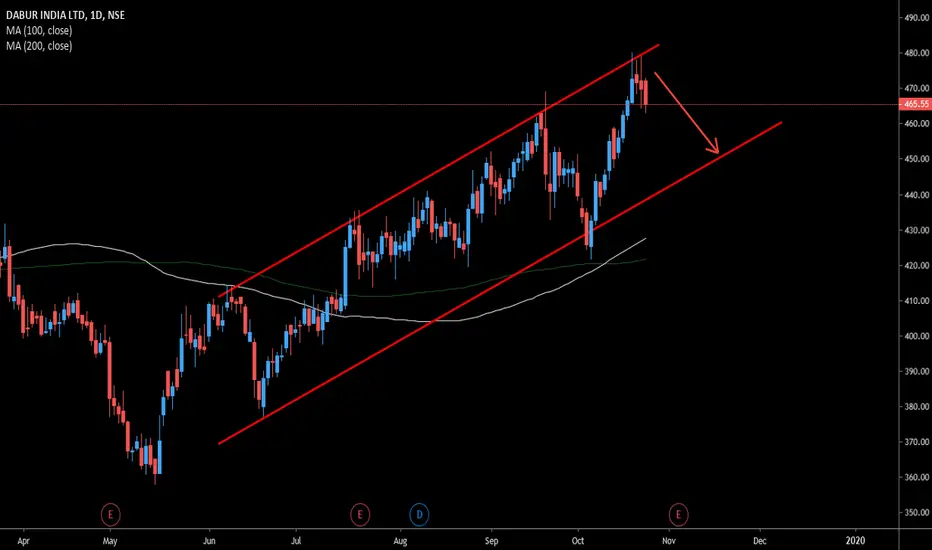
Dabur is in a trading range since July 2018.
On the weekly chart the price is toggling between 470 /364
Stock is facing monthly resistance @ 470-480 levels.
Levels of 360 - 400 cannot be ruled out.
Price may re-test the top of channel , that should be a opportunity to sell.
OI Analysis :-
OI has decreased by 3.5 % on friday - 25th which indicates long unwinding.
Trade closed: target reached
Disclaimer
The information and publications are not meant to be, and do not constitute, financial, investment, trading, or other types of advice or recommendations supplied or endorsed by TradingView. Read more in the Terms of Use.
Disclaimer
The information and publications are not meant to be, and do not constitute, financial, investment, trading, or other types of advice or recommendations supplied or endorsed by TradingView. Read more in the Terms of Use.