Rectangle Breakout on the Radar
I’ve been watching DATA for a while and what really caught my eye is this rectangle pattern that’s been forming on the daily chart. Rectangles are one of my favorite setups, they look boring while price is stuck between support and resistance, but once they break, they can move fast and clean.
Some past examples:
Continuation rectangle in daily BTC:

Trend change rectangle:

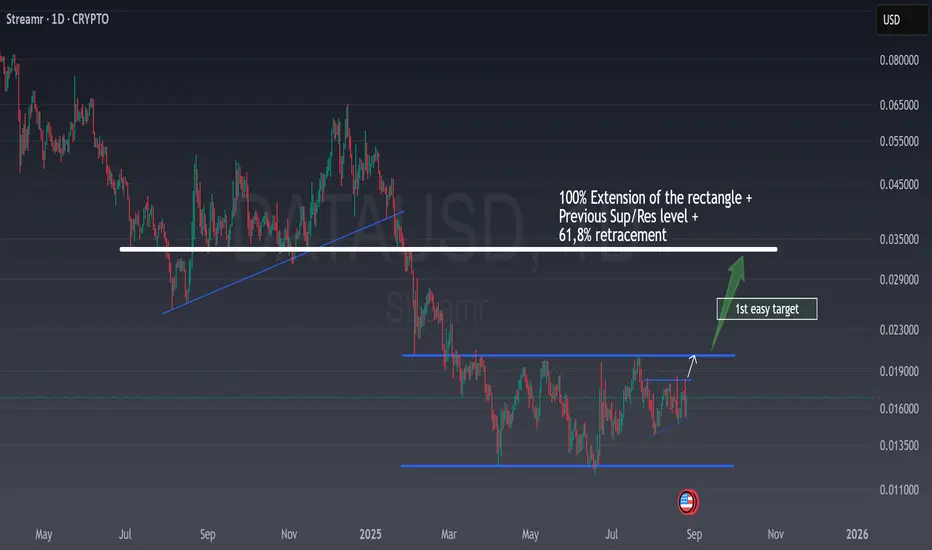
Right now, DATA is pressing against the upper boundary, and if we get a proper breakout, I’m looking at around 0.023 as a first easy target. The real prize, though, is closer to 0.035, where we’ve got a strong confluence: 100% extension of the rectangle, a major support/resistance flip, and the 61.8% retracement of the last leg down. This level will be key in case the rectangle breaks upwards.
From a trading perspective, I like the numbers here: I’m risking roughly 5% if the breakout fails, but there’s potential for +60% upside if the move extends. That’s the kind of risk/reward I don’t mind taking.
As for the project itself, Streamr has been quiet compared to the big names, but I think it’s still one of those tokens with an interesting niche (decentralized data economy). If momentum comes back into mid-cap alts, this could easily surprise to the upside. And as said inprevious post, BTC cycle is almost finished!

For me, this is a classic “wait for the breakout, then ride the wave” setup.
I’ve been watching DATA for a while and what really caught my eye is this rectangle pattern that’s been forming on the daily chart. Rectangles are one of my favorite setups, they look boring while price is stuck between support and resistance, but once they break, they can move fast and clean.
Some past examples:
Continuation rectangle in daily BTC:
Trend change rectangle:
Right now, DATA is pressing against the upper boundary, and if we get a proper breakout, I’m looking at around 0.023 as a first easy target. The real prize, though, is closer to 0.035, where we’ve got a strong confluence: 100% extension of the rectangle, a major support/resistance flip, and the 61.8% retracement of the last leg down. This level will be key in case the rectangle breaks upwards.
From a trading perspective, I like the numbers here: I’m risking roughly 5% if the breakout fails, but there’s potential for +60% upside if the move extends. That’s the kind of risk/reward I don’t mind taking.
As for the project itself, Streamr has been quiet compared to the big names, but I think it’s still one of those tokens with an interesting niche (decentralized data economy). If momentum comes back into mid-cap alts, this could easily surprise to the upside. And as said inprevious post, BTC cycle is almost finished!
For me, this is a classic “wait for the breakout, then ride the wave” setup.
⚡ Trading is not about luck or patience. Is about skills and knowledge. ⚡
I share my ideas, returns and knowledge here:
📚 👉 topchartpatterns.substack.com/subscribe 👈📚
🤝 Business contact: info@topchartpatterns.com
I share my ideas, returns and knowledge here:
📚 👉 topchartpatterns.substack.com/subscribe 👈📚
🤝 Business contact: info@topchartpatterns.com
Related publications
Disclaimer
The information and publications are not meant to be, and do not constitute, financial, investment, trading, or other types of advice or recommendations supplied or endorsed by TradingView. Read more in the Terms of Use.