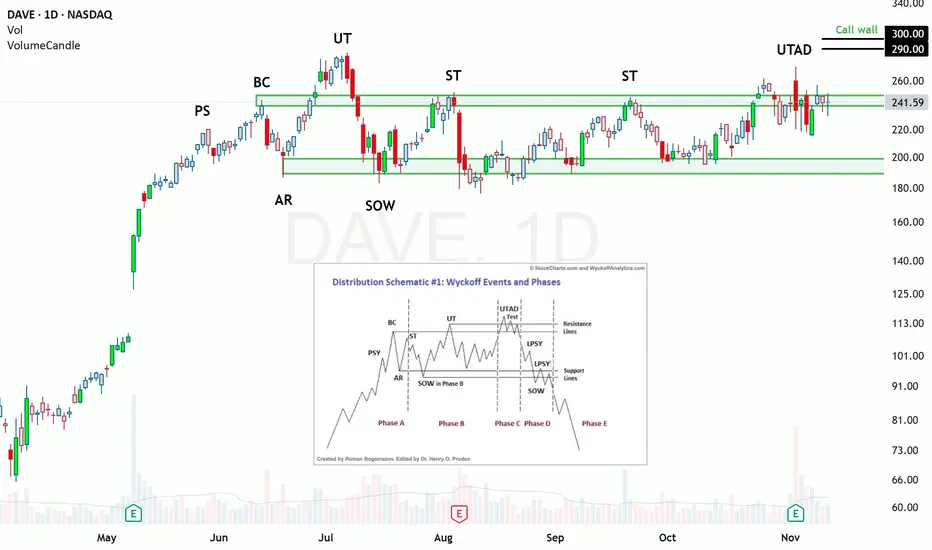
DAVE is flashing elements of a Wyckoff Distribution and could be setting up for a pullback soon. The market moves in cycles: buy low, uptrend, sell high, downtrend, repeat. The sell high part is what we are interested in for today's chart. Wyckoff theorized that you could identify when participants are finally starting to sell their shares by analyzing price and volume. The process is roughly outlined via his trading schematics.
*Note: The indicator on the chart highlights bullish and bearish candles that have above average volume for easy identification.
Phase A is all about stopping the uptrend. DAVE had a monster run from its previous earnings and we see our first evidence of profit taking at the PS. The buying climax (BC) is met with a large red sell candle with above average volume.
Phase B is about shedding shares. Note the wide candle spreads and large selling volume after the UT. Now that a range has been identified, institutions will use it to manipulate price and exit their positions. Note that the large volume days only appear at the top or bottom of the range.
Phase C is optional but I believe we are currently in it. Phase C is a test to see if there are any more buyers out there before they enter the downtrending phase. Institutions will break price above the trading range to make it seem as if the trend will continue to the upside when, in reality, they are loading up the short trade.
I have observed that this most recent earnings report has caused significant volatility. I am looking for institutions to try to send price higher. I think 180-190 would be ideal. That price is just around the initial UT high, and many traders are watching for new highs. The downside target would be about $110.
Please let me know your thoughts.
Disclaimer
The information and publications are not meant to be, and do not constitute, financial, investment, trading, or other types of advice or recommendations supplied or endorsed by TradingView. Read more in the Terms of Use.
Disclaimer
The information and publications are not meant to be, and do not constitute, financial, investment, trading, or other types of advice or recommendations supplied or endorsed by TradingView. Read more in the Terms of Use.