🔎 Technical Overview
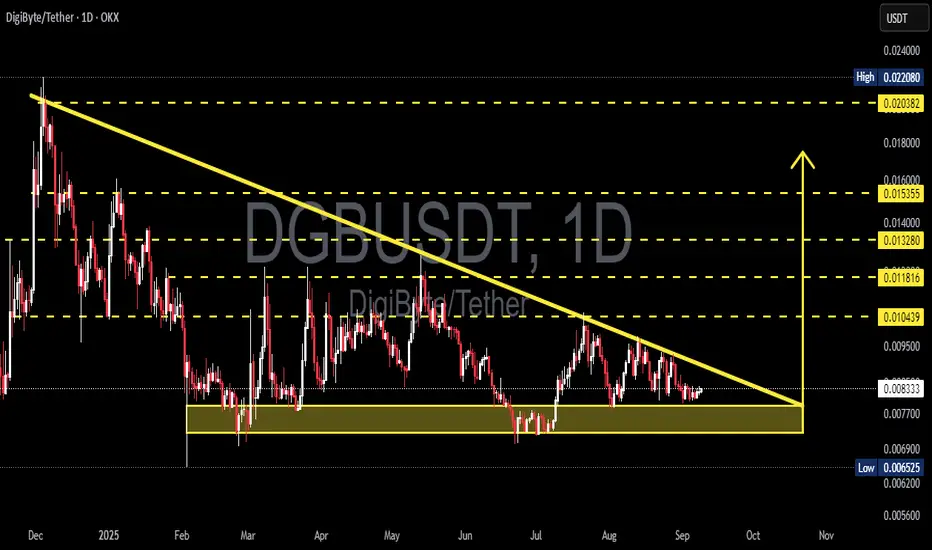
On the daily chart, DGB/USDT is forming a descending triangle, with a clear downward sloping trendline acting as dynamic resistance and a horizontal demand zone around 0.0065 – 0.0077 USDT providing strong support.
This setup reflects a phase of accumulation or distribution, where the market is preparing for a decisive move: either a bullish breakout above the descending trendline or a bearish breakdown below the demand zone.
---
📊 Key Technical Levels
Current price: 0.008295
Demand zone (support): 0.0065 – 0.0077 (yellow box)
Upside resistance levels:
0.010439 → first breakout confirmation
0.011816 → secondary resistance
0.013280 → mid-term target
0.015355 → extended target
0.020382 & 0.022080 → major upside levels if momentum accelerates
---
🟢 Bullish Scenarios
1. Confirmed Breakout (conservative):
If the price manages to close a daily candle above the descending trendline and reclaim 0.010439, bullish momentum is likely to strengthen.
Targets: 0.0118 → 0.0132 → 0.0153
Key signals: rising volume, RSI recovery, strong daily green candle.
2. Bounce from Demand (aggressive):
If price retests the 0.0065–0.0077 zone and bounces, this area may serve as a strong accumulation point.
Stop loss: below 0.0063–0.0065.
Initial target: 0.0104, with extensions to higher resistances.
Risk-to-reward ratio could be highly favorable if the bounce holds.
---
🔴 Bearish Scenario
A daily close below 0.0065 would confirm the descending triangle breakdown.
This breakdown could trigger further downside with a target toward 0.0056 or lower.
After the breakdown, the 0.0065–0.0077 zone would flip into a supply zone (resistance).
---
📌 Pattern & Sentiment
Descending Triangle: traditionally considered a bearish continuation pattern, but in crypto markets, upside breakouts are also possible.
Historical Demand Zone: the highlighted yellow box has been tested multiple times since March 2025, making it a key psychological support.
Market Sentiment: the reaction around this zone and the ability to break the trendline will dictate the medium-term direction.
---
⚖️ Conclusion & Strategy
Bullish play: wait for a breakout above 0.0104 with strong volume (safer) or accumulate cautiously in the demand zone with a tight SL (riskier).
Bearish play: a daily close below 0.0065 signals breakdown and opens the door for deeper declines.
Risk management: always use stop loss and limit exposure to 1–2% risk per trade.
DGB is currently at a make-or-break point. Whether buyers can defend the demand zone or sellers push through support will define the next big move.
---
#DGBUSDT #DGB #DigiByte #CryptoAnalysis #TechnicalAnalysis #DescendingTriangle #CryptoTrading #SupportAndResistance #Altcoins
✅ Get Free Signals! Join Our Telegram Channel Here: t.me/TheCryptoNuclear
✅ Twitter: twitter.com/crypto_nuclear
✅ Join Bybit : partner.bybit.com/b/nuclearvip
✅ Benefits : Lifetime Trading Fee Discount -50%
✅ Twitter: twitter.com/crypto_nuclear
✅ Join Bybit : partner.bybit.com/b/nuclearvip
✅ Benefits : Lifetime Trading Fee Discount -50%
Disclaimer
The information and publications are not meant to be, and do not constitute, financial, investment, trading, or other types of advice or recommendations supplied or endorsed by TradingView. Read more in the Terms of Use.