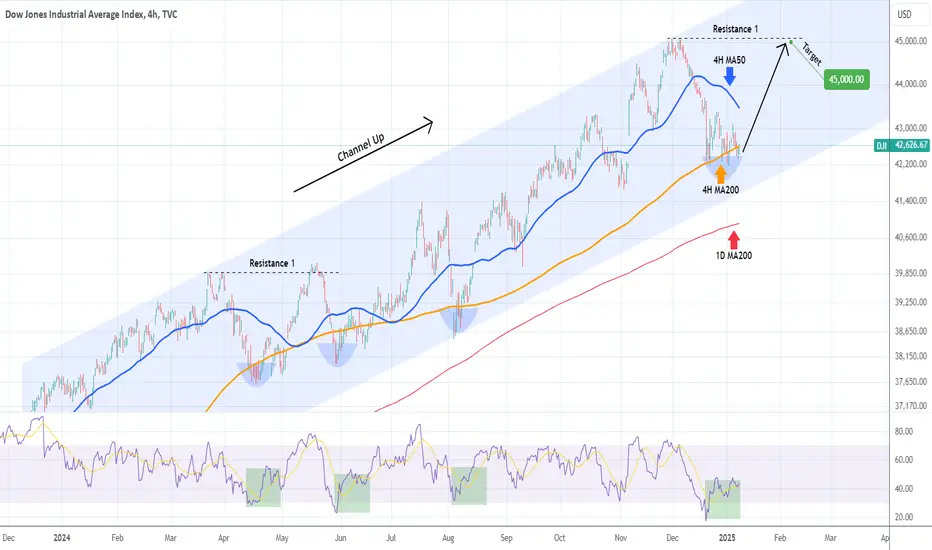
Dow Jones (DJI) has been trading within a 1-year Channel Up and is on a Bearish Leg since the December 05 2024 High. The price has found support so far 4 times on the 4H MA200 (orange trend-line) and is consolidating.
This is most likely a bottom formation as the 4H RSI is posting a Bullish Divergence similar to the 3 previous times in 2024 when the price broke below the 4H MA200. Technically once the 4H MA50 (blue trend-line) breaks, we should a confirmed Bullish Leg, which is what happened on all 3 occasions.
The minimum Target is Resistance 1 at 45000. Note that as long as the 1D MA200 (red trend-line) holds, the bullish trend will continue to be favored.
-------------------------------------------------------------------------------
** Please LIKE 👍, FOLLOW ✅, SHARE 🙌 and COMMENT ✍ if you enjoy this idea! Also share your ideas and charts in the comments section below! This is best way to keep it relevant, support us, keep the content here free and allow the idea to reach as many people as possible. **
-------------------------------------------------------------------------------
💸💸💸💸💸💸
👇 👇 👇 👇 👇 👇
👑Best Signals (Forex/Crypto+70% accuracy) & Account Management (+20% profit/month on 10k accounts)
💰Free Channel t.me/tradingshotglobal
🤵Contact info@tradingshot.com t.me/tradingshot
🔥New service: next X100 crypto GEMS!
💰Free Channel t.me/tradingshotglobal
🤵Contact info@tradingshot.com t.me/tradingshot
🔥New service: next X100 crypto GEMS!
Disclaimer
The information and publications are not meant to be, and do not constitute, financial, investment, trading, or other types of advice or recommendations supplied or endorsed by TradingView. Read more in the Terms of Use.