DLF Limited – Weekly Chart Analysis (Technical View)
Company Background:
Founded in 1946, DLF Limited is India’s largest real estate developer, renowned for its premium residential and commercial projects.
With iconic developments and vast land holdings across Delhi-NCR, Mumbai, and Bengaluru, DLF is a dominant player in high-end real estate.
Core Business Segments
Commercial Properties: IT Parks, retail malls (e.g., DLF CyberHub, DLF Emporio), Grade-A offices.
Residential: Luxurious apartments, gated communities in prime locations.
Land Bank: Extensive holdings in urban growth centers.
Leasing & Rentals: Strong recurring income from office and retail leasing.
This analysis is based on the weekly time frame, offering a medium- to long-term outlook for positional and swing traders.
Chart Structure Overview:
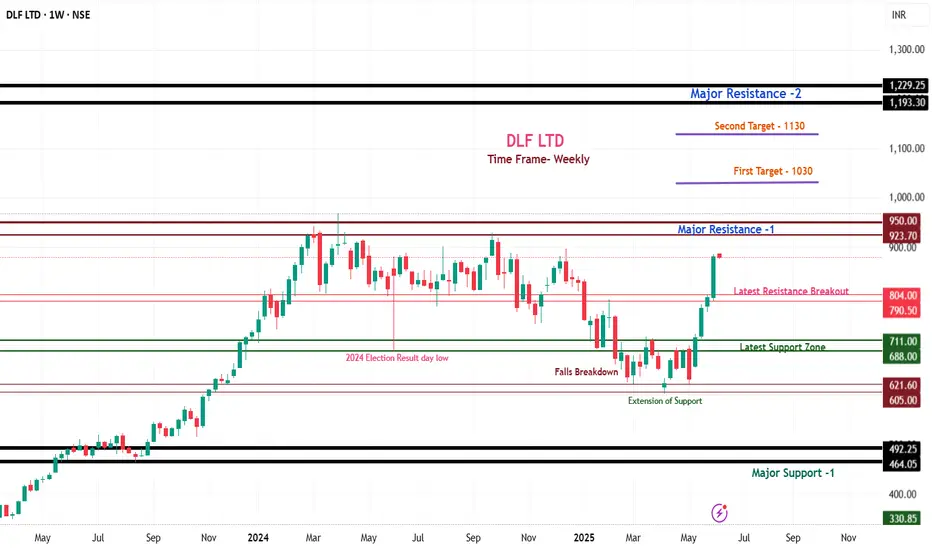
1. DLF is currently trading around ₹878 and has shown a strong recovery after retesting its breakout zone of ₹804–₹790. The structure indicates bullish momentum.
2. But a major resistance zone lies between ₹923 and ₹950. Price action near this zone will be crucial in determining the next directional move.
Bullish Scenario – If ₹950 Breaks with Volume:
The zone of ₹923 to ₹950 is a major hurdle, acting as a resistance ceiling.
A weekly close & sustain above ₹950 will confirm a strong breakout.
After that:
First Target: ₹1,030
Second Target: ₹1,130 to ₹1,180
🔽 Bearish Scenario – If Price Fails Near ₹950
The immediate support zone lies at ₹804–₹790, which earlier acted as resistance.
If the price fails to hold this level:
Next support seen at ₹711 to ₹688
A breakdown below ₹688 could lead to a deeper fall towards ₹605 to ₹621
If ₹605 breaks decisively, further downside could extend toward ₹492–₹464, which is a **major long-term support on the chart
Conclusion:
1. This is a weekly chart-based analysis, ideal for swing or positional trades. The ₹950 level is the key breakout zone for the next bull leg.
2. As long as the price remains above ₹804, the structure remains positive.
Below ₹688, trend may weaken significantly.
💬 Found this chart breakdown helpful?
👍 Like | 💭 Comment | ➕ Follow for more weekly chart analysis and breakout setups!
Published on TradingView – DLF Limited | Weekly Analysis
Company Background:
Founded in 1946, DLF Limited is India’s largest real estate developer, renowned for its premium residential and commercial projects.
With iconic developments and vast land holdings across Delhi-NCR, Mumbai, and Bengaluru, DLF is a dominant player in high-end real estate.
Core Business Segments
Commercial Properties: IT Parks, retail malls (e.g., DLF CyberHub, DLF Emporio), Grade-A offices.
Residential: Luxurious apartments, gated communities in prime locations.
Land Bank: Extensive holdings in urban growth centers.
Leasing & Rentals: Strong recurring income from office and retail leasing.
This analysis is based on the weekly time frame, offering a medium- to long-term outlook for positional and swing traders.
Chart Structure Overview:
1. DLF is currently trading around ₹878 and has shown a strong recovery after retesting its breakout zone of ₹804–₹790. The structure indicates bullish momentum.
2. But a major resistance zone lies between ₹923 and ₹950. Price action near this zone will be crucial in determining the next directional move.
Bullish Scenario – If ₹950 Breaks with Volume:
The zone of ₹923 to ₹950 is a major hurdle, acting as a resistance ceiling.
A weekly close & sustain above ₹950 will confirm a strong breakout.
After that:
First Target: ₹1,030
Second Target: ₹1,130 to ₹1,180
🔽 Bearish Scenario – If Price Fails Near ₹950
The immediate support zone lies at ₹804–₹790, which earlier acted as resistance.
If the price fails to hold this level:
Next support seen at ₹711 to ₹688
A breakdown below ₹688 could lead to a deeper fall towards ₹605 to ₹621
If ₹605 breaks decisively, further downside could extend toward ₹492–₹464, which is a **major long-term support on the chart
Conclusion:
1. This is a weekly chart-based analysis, ideal for swing or positional trades. The ₹950 level is the key breakout zone for the next bull leg.
2. As long as the price remains above ₹804, the structure remains positive.
Below ₹688, trend may weaken significantly.
💬 Found this chart breakdown helpful?
👍 Like | 💭 Comment | ➕ Follow for more weekly chart analysis and breakout setups!
Published on TradingView – DLF Limited | Weekly Analysis
Disclaimer
The information and publications are not meant to be, and do not constitute, financial, investment, trading, or other types of advice or recommendations supplied or endorsed by TradingView. Read more in the Terms of Use.
Disclaimer
The information and publications are not meant to be, and do not constitute, financial, investment, trading, or other types of advice or recommendations supplied or endorsed by TradingView. Read more in the Terms of Use.