As per the Latest SEBI Mandate, this isn't a Trading/Investment RECOMMENDATION nor for Educational Purposes; it is just for Informational purposes only. The chart data used is 3 Months old, as Showing Live Chart Data is not allowed according to the New SEBI Mandate.
Disclaimer: "I am not a SEBI REGISTERED RESEARCH ANALYST AND INVESTMENT ADVISER."
This analysis is intended solely for informational purposes and should not be interpreted as financial advice. It is advisable to consult a qualified financial advisor or conduct thorough research before making investment decisions.
Price Action Analysis:
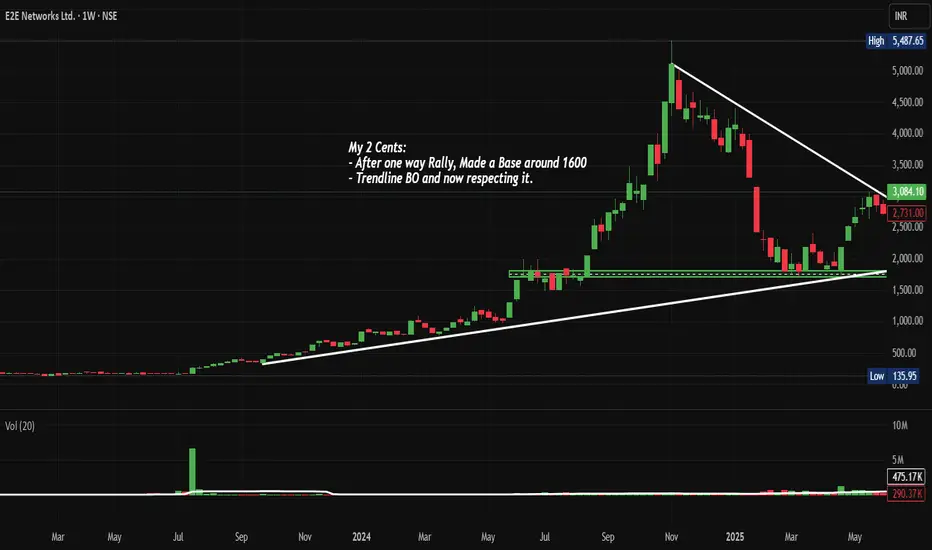
• Stock has formed a massive symmetrical triangle/wedge pattern
• Recent breakout above the upper trendline resistance around 2,900-3,000 levels
• Currently trading at 3,084.10 with strong momentum and above-average volume
• Price action shows a clear shift from consolidation to the trending phase
• Multiple higher lows formation during the consolidation phase indicates underlying strength
Volume Spread Analysis:
• Volume spike visible during the recent breakout, confirming genuine buying interest
• Volume at 813.46K vs average volume of 422.91K, indicating a 92% increase
• Consistent volume support during the base formation phase
• Volume-price confirmation suggests institutional participation
Key Technical Levels:
Support Levels:
• Primary Support: 2,700-2,800 (previous resistance turned support)
• Secondary Support: 2,400-2,500 (triangle breakout level)
• Major Support: 2,000-2,100 (psychological level and previous consolidation zone)
Resistance Levels:
• Immediate Resistance: 3,200-3,300 (next psychological level)
• Major Resistance: 3,500-3,600 (measured move target from triangle)
• All-time High: 5,487.65 (long-term target)
Technical Patterns:
• Symmetrical Triangle: 15-month consolidation pattern completed with upside breakout
• Base Formation: Strong base around 1,600 levels as mentioned in the chart annotation
• Ascending Triangle: Multiple retests of resistance with higher lows
• Volume Breakout Pattern: Confirmed with increased participation
Technical Assessment:
• Trendline Breakout: Clean break above descending trendline resistance
• Price Structure: Shift from consolidation to trending phase
• Momentum: Strong upward momentum post-breakout
• Support-Resistance Flip: Previous resistance becomes new support
Risk Management:
• Maximum Risk: 10% of position size
• Volatility Risk: High (small-cap IT stock)
• Sector Risk: Technology sector concentration
Risk Mitigation:
• Diversification across the IT portfolio
• Position sizing discipline
• Regular monitoring of technical levels
• Sector rotation consideration
Sectoral Analysis:
Industry Overview:
• India's data center industry is undergoing a major transformation, driven by the rapid rise in digital adoption, AI-driven workloads, and cloud computing adoption
• In 2025, E2E Cloud, a leading AI-centric cloud service provider, announced the launch of India's largest NVIDIA H200 GPU infrastructure
• Strong government support for Digital India initiatives
• Growing demand for cloud computing and AI/ML services
Sector Positioning:
• E2E network provides a full-stack AI/ML and GenAI cloud ecosystem designed for scalable, accessible, and cost-efficient deployment of large-scale compute clusters
• E2E Networks provides enterprise-grade GPU computing at a much lower cost by removing the complexity and extra expenses linked to global hyperscale providers
• Strategic focus on AI and machine learning infrastructure
• Competitive advantage in cost-effective cloud solutions
Growth Drivers:
• Increasing AI adoption across industries
• Digital transformation acceleration post-COVID
• Government push for data localization
• Growing startup ecosystem requiring cloud infrastructure
Fundamental Backdrop:
Financial Performance:
• Revenue: 159 Cr with Profit: 34.5 Cr (TTM)
• Revenue from operations slumped -12.63% YoY to Rs 36.11 crore in Q1 FY26
• Profit before tax (PBT) stood at Rs -2.84 crore in Q1 FY26, steeply lower than Rs 10.14 crore in Q1 FY25
• Strong profitability growth trajectory
Market Capitalization & Valuation:
• Mkt Cap: 6,166 Crore (up 10.8% in 1 year)
• Small Cap company classification
Shareholding Pattern:
• Promoter Holding: 40.6%
• Promoter holding has decreased over the last quarter: -3.00%
• Mutual Fund Shareholding in E2E Networks was 1.86%
• Strong promoter holding with some recent reduction
Business Model Strength:
• E2E CDN is a global content delivery network that distributes your content & web pages to end-users with minimal latency
• Asset-light scalable business model
• Recurring revenue from cloud services
• Growing customer base in the AI/ML segment
Key Concerns:
• Though the company is reporting repeated profits, it is not paying out a dividend
• High valuation multiples indicate growth expectations
• Small-cap volatility and liquidity concerns
• Intense competition from global cloud providers
Bull Case:
• Strong technical breakout
• Leadership position in Indian AI/ML cloud infrastructure
• Beneficiary of India's digital transformation
• Scalable business model with high growth potential
Bear Case:
• Expensive valuation with high growth expectations
• Competition from global hyperscalers
• Small-cap inherent volatility
• Dependency on the technology sector performance
Overall Assessment:
• Technically strong setup with favourable risk-reward
• Fundamentally positioned in a high-growth sector
• Regular monitoring required due to small-cap nature
Full Coverage on my Newsletter this Week
Keep in the Watchlist and DOYR.
NO RECO. For Buy/Sell.
📌Thank you for exploring my idea! I hope you found it valuable.
🙏FOLLOW for more
👍BOOST if you found it useful.
✍️COMMENT below with your views.
Meanwhile, check out my other stock ideas on the right side until this trade is activated. I would love your feedback.
As per the Latest SEBI Mandate, this isn't a Trading/Investment RECOMMENDATION nor for Educational Purposes, it is just for Informational purposes only. The chart data used is 3 Months old, as Showing Live Chart Data is not allowed according to the New SEBI Mandate.
Disclaimer: "I am not a SEBI REGISTERED RESEARCH ANALYST AND INVESTMENT ADVISER."
This analysis is intended solely for informational purposes and should not be interpreted as financial advice. It is advisable to consult a qualified financial advisor or conduct thorough research before making investment decisions.
Related publications
Disclaimer
The information and publications are not meant to be, and do not constitute, financial, investment, trading, or other types of advice or recommendations supplied or endorsed by TradingView. Read more in the Terms of Use.
Related publications
Disclaimer
The information and publications are not meant to be, and do not constitute, financial, investment, trading, or other types of advice or recommendations supplied or endorsed by TradingView. Read more in the Terms of Use.