Today’s chart highlights the value of multi-timeframe analysis for structured observation.
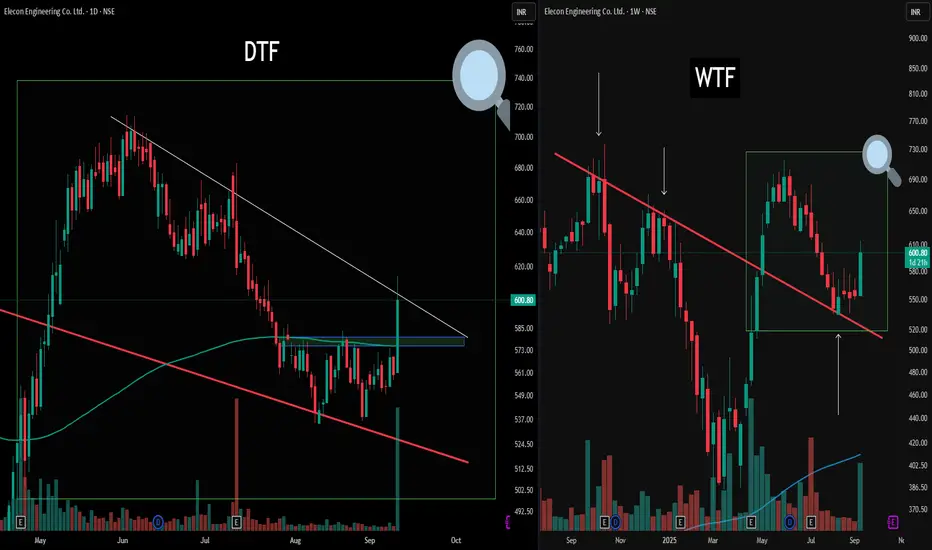
On the right (WTF), the weekly perspective provides a broad structure, showcasing a clean counter trendline and its reaction zone. A green box and magnifier zoom into this region, framing the context for the daily (DTF) chart on the left.
On the DTF view, the same zone is explored in detail. Here, there's an active counter trendline (white) and a pronounced double bottom formation resting on a blue Flip zone—noted for educational reference rather than outcome prediction. Both timeframes display how structural overlaps and retests can be identified, serving as useful pattern recognition and risk management.
Disclaimer: Trading involves significant risk and is not suitable for all investors. Past performance does not guarantee future results. Always conduct your own research, consider seeking advice from a qualified financial advisor, and trade only with capital you can afford to lose.
🏆 Join Telegram for More FREE Perks : t.me/hashtaghammer
🏆 Message Today to Learn my A+ Strategy : wa.me/919455664601
🏆 Message Today to Learn my A+ Strategy : wa.me/919455664601
Related publications
Disclaimer
The information and publications are not meant to be, and do not constitute, financial, investment, trading, or other types of advice or recommendations supplied or endorsed by TradingView. Read more in the Terms of Use.