________________________________________________________________________________
📈 EMAMI LTD – Strong Bullish Breakout | Volume Spike | Structure-Based Trade Idea
🕒 Chart Type: Daily Chart
📆 Date: July 9, 2025
________________________________________________________________________________
📌 Price Action:
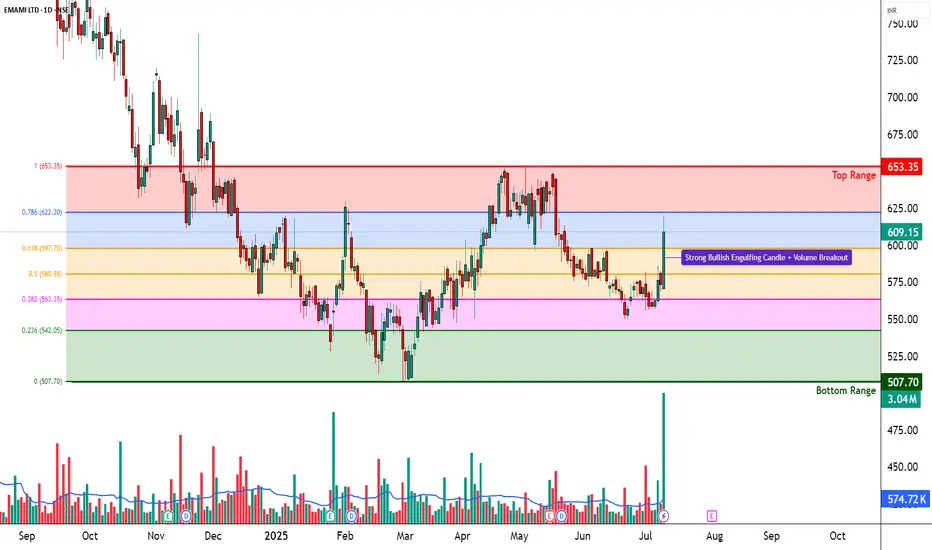
EMAMI LTD has delivered a decisive breakout from its recent compression phase after trading sideways between 570–585 for several sessions. On July 9, the stock posted a wide-range bullish candle, closing at 609.15, backed by high delivery and breakout volume. The candle formed with an open = low structure, a strong intraday move, and solid closing near the high, confirming buyer dominance. This marks a shift in control from range-bound consolidation to potential momentum continuation.
________________________________________________________________________________
📊 Chart Pattern:
This breakout is from a Box Compression Zone, where the stock had been moving within a tight band. This is a textbook bullish compression breakout, often seen before short-term trend expansions. The range contraction, followed by a sudden expansion with volume, signals that smart money may be entering. Though not a VCP, the narrowing of ranges followed by a strong candle reflects controlled buildup and release of bullish pressure.
________________________________________________________________________________
🕯️ Candlestick Pattern:
Bullish Engulfing
Open = Low Candle
Momentum Continuation Candle
The current candle also fits the "Buy Today, Sell Tomorrow" setup logic, especially useful for short-term intraday/momentum traders from an educational lens.
________________________________________________________________________________
🔊 Volume Analysis:
Volume on July 9 crossed 3x the 20-day average, showing an institutional-grade breakout. What's more important is that this move comes after multiple low-volume sessions, which indicates that the base was silent before this burst — classic sign of accumulation followed by breakout. The presence of a BB squeeze and volume compression breakout confirms the start of a volatility expansion phase.
________________________________________________________________________________
📈 Technical Indicators:
RSI (Daily): 65 – strong and rising
MACD: Bullish crossover on Daily, but flat on Weekly/Monthly
CCI: 319 – strong bullish momentum reading
Stochastic: 85 – in a bullish zone, showing follow-through possibility
SuperTrend & VWAP: Bullish bias confirmed
BB Squeeze: Compression off, likely start of expansion
These indicators align well to show a breakout backed by momentum and volume expansion.
________________________________________________________________________________
🧱 Support & Resistance:
🔺 Resistance Zones to Watch:
629.23 – First key level where supply may come in
649.32 – Major resistance from previous swing
678.63 – Long-term resistance zone
Top Range: 653.35 – Official top of the recent consolidation base
🔻 Support Levels:
579.83 – Immediate support post-breakout
550.52 – Minor swing base
530.43 – Deeper demand level from which recent trend started
Bottom Range (Demand Zone): 507.70 – Long-term structural support
________________________________________________________________________________
👀 What’s Catching Our Eye:
What stands out in this chart is the confluence of breakout signals — RSI breakout, engulfing candle, Bollinger squeeze off, and high delivery volume — all firing together. The open-low bullish bar is not just random price movement; it's a statement from buyers that they're ready to defend this zone.
________________________________________________________________________________
🔍 What We’re Watching For:
We’re watching if EMAMI can sustain above 609–620 for the next couple of sessions. A consolidation above this zone will indicate strength. On the flip side, any rejection and close back below 579.83 will raise flags. We're also watching for any mild retest toward 580–585 on low volume, which can offer a secondary low-risk entry opportunity.
________________________________________________________________________________
✅ Best Buy Level for Equity (Low Risk Idea):
Breakout Entry: Above 620 with follow-through or retest confirmation
Pullback Buy: Into the 579.83–585 support zone with a strong bounce candle
Stop Loss: 560.33 (structure-based, on closing basis)
Risk-Reward Lens: Start with a 1:1 target; trail for 1:2+ based on structure — avoid fixed upside projections
________________________________________________________________________________
💼 Sector Tailwinds:
The FMCG and personal care space is seeing renewed demand due to rising rural consumption, price stability in raw materials, and stronger brand-led companies gaining market share. EMAMI, with a wide product portfolio, is well-positioned to benefit. Fundamentally, the stock is also recovering from long-term price compression — aligning well with the recent breakout.
________________________________________________________________________________
⚠️ Risk to Watch:
A close below 579 will invalidate the breakout setup
Indicators are strong but slightly stretched, so chasing blindly can invite volatility
The price must confirm above 620+ for the trend to gain broader legs
Always wait for follow-through before committing fresh capital
________________________________________________________________________________
🔮 What to Expect Next:
If EMAMI sustains above 609–620, the stock could gradually move toward 629.23 and test higher levels like 649.32. But if it fails to hold above the breakout candle, we may see a pullback to 580–585. Either way, price and volume in the next 2–3 sessions will confirm whether this is a false breakout or the start of a real trend.
________________________________________________________________________________
🧠 How to Trade EMAMI LTD (For Educational Use Only):
Breakout Plan (Hypothetical Setup):
🔹 Entry: Above 620 only if follow-through confirmation candle appears
🔹 Stop Loss: 560.33 (on closing basis)
🔹 Pullback Buy: Into 580–585 with same SL, if bullish reversal shows
🔹 Risk-Reward: 1:1 minimum; trail for more
🔹 Position Sizing: Use capital allocation based on risk tolerance — never go all-in on breakout
________________________________________________________________________________
⚠️ Disclaimer (Please Read):
• This chart is shared for educational purposes only and is not investment advice.
• I am not a SEBI-registered advisor.
• The information provided here is based on personal market observation.
• No buy/sell recommendations are being made.
• Please do your own research or consult a registered financial advisor before making any trading decisions.
• Trading involves risk. Always use proper risk management.
________________________________________________________________________________
💬 Found this helpful?
What would be your ideal trade in EMAMI — breakout follow-through or support pullback?
Drop your thoughts in the comments below ⬇️
🔁 Share this with your trading community
✅ Follow STWP for clean technical setups backed by price action and volume
🚀 Let’s trade with patience, logic, and clarity!
Be Self-Reliant | Trade with Patience | Learn with Logic
________________________________________________________________________________
📈 EMAMI LTD – Strong Bullish Breakout | Volume Spike | Structure-Based Trade Idea
🕒 Chart Type: Daily Chart
📆 Date: July 9, 2025
________________________________________________________________________________
📌 Price Action:
EMAMI LTD has delivered a decisive breakout from its recent compression phase after trading sideways between 570–585 for several sessions. On July 9, the stock posted a wide-range bullish candle, closing at 609.15, backed by high delivery and breakout volume. The candle formed with an open = low structure, a strong intraday move, and solid closing near the high, confirming buyer dominance. This marks a shift in control from range-bound consolidation to potential momentum continuation.
________________________________________________________________________________
📊 Chart Pattern:
This breakout is from a Box Compression Zone, where the stock had been moving within a tight band. This is a textbook bullish compression breakout, often seen before short-term trend expansions. The range contraction, followed by a sudden expansion with volume, signals that smart money may be entering. Though not a VCP, the narrowing of ranges followed by a strong candle reflects controlled buildup and release of bullish pressure.
________________________________________________________________________________
🕯️ Candlestick Pattern:
Bullish Engulfing
Open = Low Candle
Momentum Continuation Candle
The current candle also fits the "Buy Today, Sell Tomorrow" setup logic, especially useful for short-term intraday/momentum traders from an educational lens.
________________________________________________________________________________
🔊 Volume Analysis:
Volume on July 9 crossed 3x the 20-day average, showing an institutional-grade breakout. What's more important is that this move comes after multiple low-volume sessions, which indicates that the base was silent before this burst — classic sign of accumulation followed by breakout. The presence of a BB squeeze and volume compression breakout confirms the start of a volatility expansion phase.
________________________________________________________________________________
📈 Technical Indicators:
RSI (Daily): 65 – strong and rising
MACD: Bullish crossover on Daily, but flat on Weekly/Monthly
CCI: 319 – strong bullish momentum reading
Stochastic: 85 – in a bullish zone, showing follow-through possibility
SuperTrend & VWAP: Bullish bias confirmed
BB Squeeze: Compression off, likely start of expansion
These indicators align well to show a breakout backed by momentum and volume expansion.
________________________________________________________________________________
🧱 Support & Resistance:
🔺 Resistance Zones to Watch:
629.23 – First key level where supply may come in
649.32 – Major resistance from previous swing
678.63 – Long-term resistance zone
Top Range: 653.35 – Official top of the recent consolidation base
🔻 Support Levels:
579.83 – Immediate support post-breakout
550.52 – Minor swing base
530.43 – Deeper demand level from which recent trend started
Bottom Range (Demand Zone): 507.70 – Long-term structural support
________________________________________________________________________________
👀 What’s Catching Our Eye:
What stands out in this chart is the confluence of breakout signals — RSI breakout, engulfing candle, Bollinger squeeze off, and high delivery volume — all firing together. The open-low bullish bar is not just random price movement; it's a statement from buyers that they're ready to defend this zone.
________________________________________________________________________________
🔍 What We’re Watching For:
We’re watching if EMAMI can sustain above 609–620 for the next couple of sessions. A consolidation above this zone will indicate strength. On the flip side, any rejection and close back below 579.83 will raise flags. We're also watching for any mild retest toward 580–585 on low volume, which can offer a secondary low-risk entry opportunity.
________________________________________________________________________________
✅ Best Buy Level for Equity (Low Risk Idea):
Breakout Entry: Above 620 with follow-through or retest confirmation
Pullback Buy: Into the 579.83–585 support zone with a strong bounce candle
Stop Loss: 560.33 (structure-based, on closing basis)
Risk-Reward Lens: Start with a 1:1 target; trail for 1:2+ based on structure — avoid fixed upside projections
________________________________________________________________________________
💼 Sector Tailwinds:
The FMCG and personal care space is seeing renewed demand due to rising rural consumption, price stability in raw materials, and stronger brand-led companies gaining market share. EMAMI, with a wide product portfolio, is well-positioned to benefit. Fundamentally, the stock is also recovering from long-term price compression — aligning well with the recent breakout.
________________________________________________________________________________
⚠️ Risk to Watch:
A close below 579 will invalidate the breakout setup
Indicators are strong but slightly stretched, so chasing blindly can invite volatility
The price must confirm above 620+ for the trend to gain broader legs
Always wait for follow-through before committing fresh capital
________________________________________________________________________________
🔮 What to Expect Next:
If EMAMI sustains above 609–620, the stock could gradually move toward 629.23 and test higher levels like 649.32. But if it fails to hold above the breakout candle, we may see a pullback to 580–585. Either way, price and volume in the next 2–3 sessions will confirm whether this is a false breakout or the start of a real trend.
________________________________________________________________________________
🧠 How to Trade EMAMI LTD (For Educational Use Only):
Breakout Plan (Hypothetical Setup):
🔹 Entry: Above 620 only if follow-through confirmation candle appears
🔹 Stop Loss: 560.33 (on closing basis)
🔹 Pullback Buy: Into 580–585 with same SL, if bullish reversal shows
🔹 Risk-Reward: 1:1 minimum; trail for more
🔹 Position Sizing: Use capital allocation based on risk tolerance — never go all-in on breakout
________________________________________________________________________________
⚠️ Disclaimer (Please Read):
• This chart is shared for educational purposes only and is not investment advice.
• I am not a SEBI-registered advisor.
• The information provided here is based on personal market observation.
• No buy/sell recommendations are being made.
• Please do your own research or consult a registered financial advisor before making any trading decisions.
• Trading involves risk. Always use proper risk management.
________________________________________________________________________________
💬 Found this helpful?
What would be your ideal trade in EMAMI — breakout follow-through or support pullback?
Drop your thoughts in the comments below ⬇️
🔁 Share this with your trading community
✅ Follow STWP for clean technical setups backed by price action and volume
🚀 Let’s trade with patience, logic, and clarity!
Be Self-Reliant | Trade with Patience | Learn with Logic
________________________________________________________________________________
STWP | Mentor & Demand-Supply Specialist | Empowering traders through structured learning |
simpletradewithpatience.com
Community: chat.whatsapp.com/BEYz0tkqP0fJPBCWf59uel
wa.me/message/6IOPHGOXMGZ4N1
Educational Only
simpletradewithpatience.com
Community: chat.whatsapp.com/BEYz0tkqP0fJPBCWf59uel
wa.me/message/6IOPHGOXMGZ4N1
Educational Only
Disclaimer
The information and publications are not meant to be, and do not constitute, financial, investment, trading, or other types of advice or recommendations supplied or endorsed by TradingView. Read more in the Terms of Use.