ETERNAL (Zomato) had been on a strong bull run since April 2025, rallying from ₹195 to ₹344 🚀. Throughout this journey, the stock consistently respected an upward trendline, bouncing every time it touched the line.
But things changed on 26th September 2025:
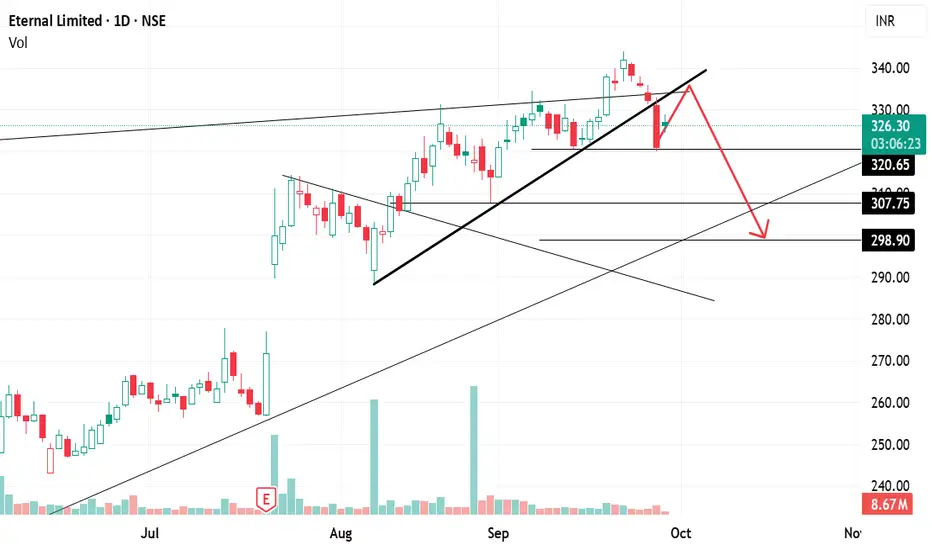
❌ The stock broke down below the trendline support for the first time.
After the breakdown, it reached a low of ₹320, signaling that the structure had become weak
✨ 1. Trendline Signals (Daily Chart)
If we connect all the key highs of September 2024, December 2024, August 2025, and September 2025, we obtain a resistance trendline.
Recently, the stock gave a breakout above this trendline, but it failed to sustain and quickly slipped back below it.
This false breakout followed by weakness is often a bearish signal ⚠️.
📅 2. Short-Term View
Right now, the stock is hovering near ₹320, a critical support level.
If ₹320 breaks decisively, the weakness will get confirmed, and the stock may head toward:
🎯 ₹310
🎯 ₹300 (short-term target zone).
Until then, some retracement or sideways movement may happen, but the overall bias is weak.
🕰️ 3. Weekly Chart View (Bigger Picture)
Last week, the stock formed a bearish engulfing candle, where the body of the red candle completely covers the body of the previous green candle.
This pattern is a reversal signal, showing sellers overpowering buyers.
If this week’s close is below ₹320, it will confirm the bearish engulfing pattern ✅, adding further weight to the downside scenario.
📌 Summary:
🔻 Weakness Detected: Breakdown of trendline + false breakout on resistance.
⚠️ Confirmation Needed: Closing below ₹320 will confirm bearish engulfing and continuation of weakness.
🎯 Targets: If ₹320 breaks, next levels are ₹310 and ₹300.
🛡️ If ₹320 holds: Stock may bounce, but the overall structure remains fragile.
But things changed on 26th September 2025:
❌ The stock broke down below the trendline support for the first time.
After the breakdown, it reached a low of ₹320, signaling that the structure had become weak
✨ 1. Trendline Signals (Daily Chart)
If we connect all the key highs of September 2024, December 2024, August 2025, and September 2025, we obtain a resistance trendline.
Recently, the stock gave a breakout above this trendline, but it failed to sustain and quickly slipped back below it.
This false breakout followed by weakness is often a bearish signal ⚠️.
📅 2. Short-Term View
Right now, the stock is hovering near ₹320, a critical support level.
If ₹320 breaks decisively, the weakness will get confirmed, and the stock may head toward:
🎯 ₹310
🎯 ₹300 (short-term target zone).
Until then, some retracement or sideways movement may happen, but the overall bias is weak.
🕰️ 3. Weekly Chart View (Bigger Picture)
Last week, the stock formed a bearish engulfing candle, where the body of the red candle completely covers the body of the previous green candle.
This pattern is a reversal signal, showing sellers overpowering buyers.
If this week’s close is below ₹320, it will confirm the bearish engulfing pattern ✅, adding further weight to the downside scenario.
📌 Summary:
🔻 Weakness Detected: Breakdown of trendline + false breakout on resistance.
⚠️ Confirmation Needed: Closing below ₹320 will confirm bearish engulfing and continuation of weakness.
🎯 Targets: If ₹320 breaks, next levels are ₹310 and ₹300.
🛡️ If ₹320 holds: Stock may bounce, but the overall structure remains fragile.
Disclaimer
The information and publications are not meant to be, and do not constitute, financial, investment, trading, or other types of advice or recommendations supplied or endorsed by TradingView. Read more in the Terms of Use.
Disclaimer
The information and publications are not meant to be, and do not constitute, financial, investment, trading, or other types of advice or recommendations supplied or endorsed by TradingView. Read more in the Terms of Use.