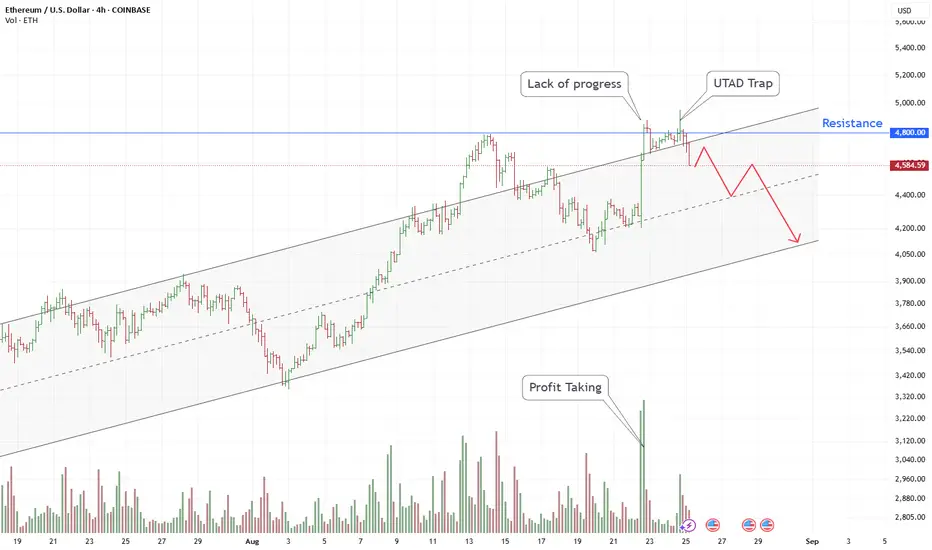
Despite an uptrend since early August that has formed a stable channel, the ETH/USD price has been showing clear signs of weakness in recent days.
The chart shows that the price is struggling to advance above the key resistance level of $4800. This "Lack of progress," combined with a volume spike marked as "Profit Taking," suggests that large players ("smart money") may be selling their assets.
The recent false breakout above $4800 can be interpreted as a "UTAD Trap" (Upthrust After Distribution). Such maneuvers are often used to capture liquidity before initiating a downward phase.
Based on this, the current situation suggests the beginning of a downward correction. A likely target for this move is first the channel's midline around $4,400, after which the price may head towards its lower boundary in the $4,100-$4,200 region.
Supply And Demand Trading .com
Disclaimer
The information and publications are not meant to be, and do not constitute, financial, investment, trading, or other types of advice or recommendations supplied or endorsed by TradingView. Read more in the Terms of Use.
Supply And Demand Trading .com
Disclaimer
The information and publications are not meant to be, and do not constitute, financial, investment, trading, or other types of advice or recommendations supplied or endorsed by TradingView. Read more in the Terms of Use.