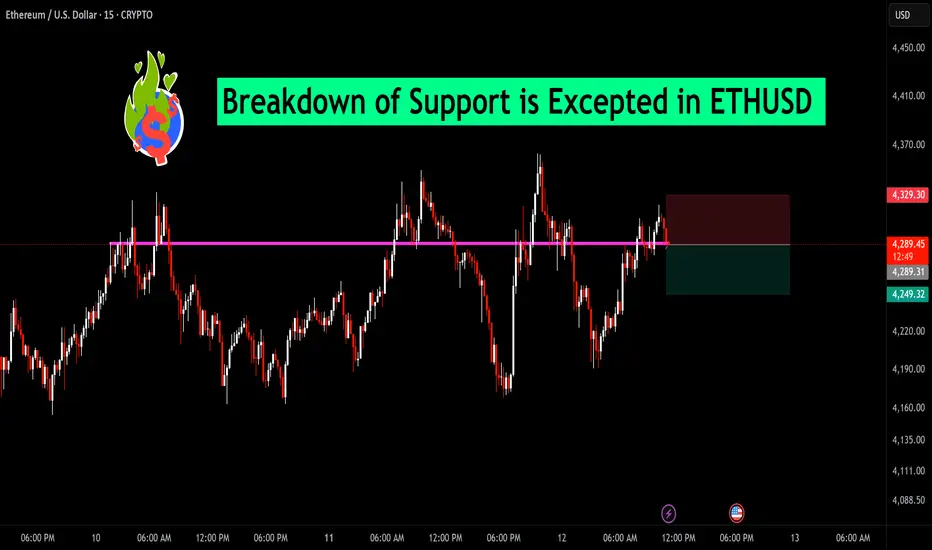
Ethereum is currently hovering just above a key horizontal support zone near $4,289. Price has tested this level multiple times, and selling pressure appears to be increasing. A decisive breakdown below this zone could trigger a short-term bearish move toward the next support near $4,249.
Traders should watch for a strong close below this support on the 15-min chart to confirm the breakdown. A tight stop above $4,329 could help manage risk for short positions.
Bias: Bearish below $4,289 | Bullish recovery only above $4,329
Traders should watch for a strong close below this support on the 15-min chart to confirm the breakdown. A tight stop above $4,329 could help manage risk for short positions.
Bias: Bearish below $4,289 | Bullish recovery only above $4,329
Get BTST Toolkit:
Contact below to get access ⬇️
✅Whatsapp: wa.me/919084286797
✅ Telegram: t.me/breakoutinvesting
⭐ Custom Indicator
⭐ BTST Calls
⭐ FNO Trades
⭐ Algo Trading
Contact below to get access ⬇️
✅Whatsapp: wa.me/919084286797
✅ Telegram: t.me/breakoutinvesting
⭐ Custom Indicator
⭐ BTST Calls
⭐ FNO Trades
⭐ Algo Trading
Disclaimer
The information and publications are not meant to be, and do not constitute, financial, investment, trading, or other types of advice or recommendations supplied or endorsed by TradingView. Read more in the Terms of Use.