🔹 Chart Overview:
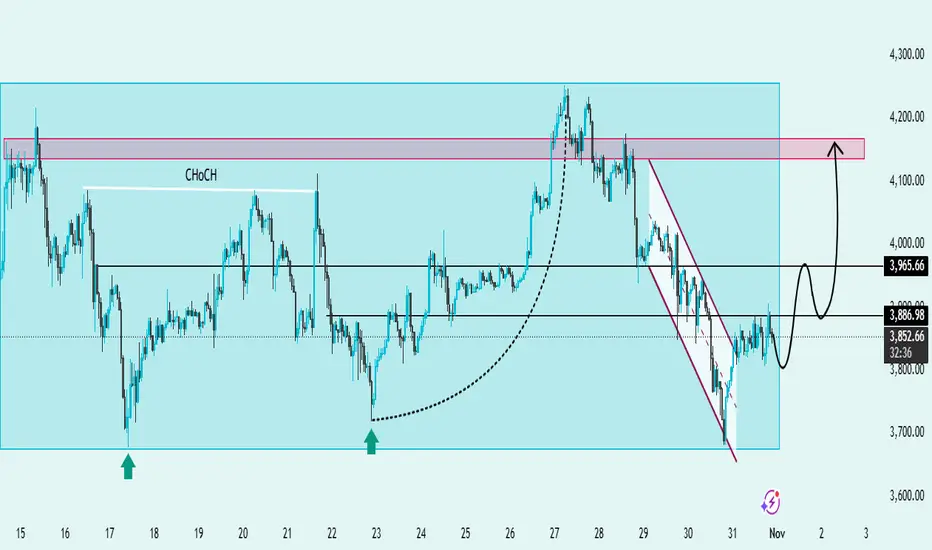
The chart illustrates a clear market structure shift (CHoCH) followed by a descending channel breakout, signaling a potential bullish reversal.
Price action has respected the major support zone around $3,700–$3,750 and is now showing signs of recovery.
💹 Key Levels:
Support Zone: $3,700 – $3,750 🛡️
Immediate Resistance: $3,965 ⚔️
Major Resistance Zone: $4,150 – $4,200 🧱
📈 Bullish Scenario (Main Bias):
ETH has broken out from the falling wedge pattern, a classic bullish reversal signal ✅.
If price sustains above $3,880–$3,900, we may see continuation toward the $3,965 short-term resistance and potentially a rally toward the $4,200 zone 🎯.
Confirmation Signs:
Retest of breakout trendline holds support 🟢
Higher highs and higher lows begin forming 🔄
⚠️ Bearish Scenario (Alternative View):
If ETH fails to hold above $3,850,
it may retest the $3,700 base again for liquidity before attempting a stronger rebound 📉.
🎯 Trading Outlook:
Bias: Bullish (reversal in progress)
Entry Zone: $3,850 – $3,880 (on confirmation)
Targets:
TP1: $3,965
TP2: $4,150 – $4,200
Invalidation: Break below $3,700 ❌
📌 Conclusion:
ETH/USD is showing a bullish recovery setup after breaking its descending channel.
Maintaining support above $3,850 could fuel a move toward $4,200, completing a clean market structure reversal 🌕💪
Trade active
JOIN MY TELEGRAM CHANNEL LINK 👇🏻
t.me/Classicallegendschool
t.me/Classicallegendschool
Disclaimer
The information and publications are not meant to be, and do not constitute, financial, investment, trading, or other types of advice or recommendations supplied or endorsed by TradingView. Read more in the Terms of Use.