ETH Attempts To Break June Falling Trendline And Turn Bullish
- Ethereum is up 9% today as the cryptocurrency soars back above $2000 again.
- It is now testing the June falling trendline as it attempts to break the downtrend from the month.
- Against Bitcoin itself, Ethereum managed to rebound from support at ₿0.056 and is back above ₿0.061.
What has been going on?
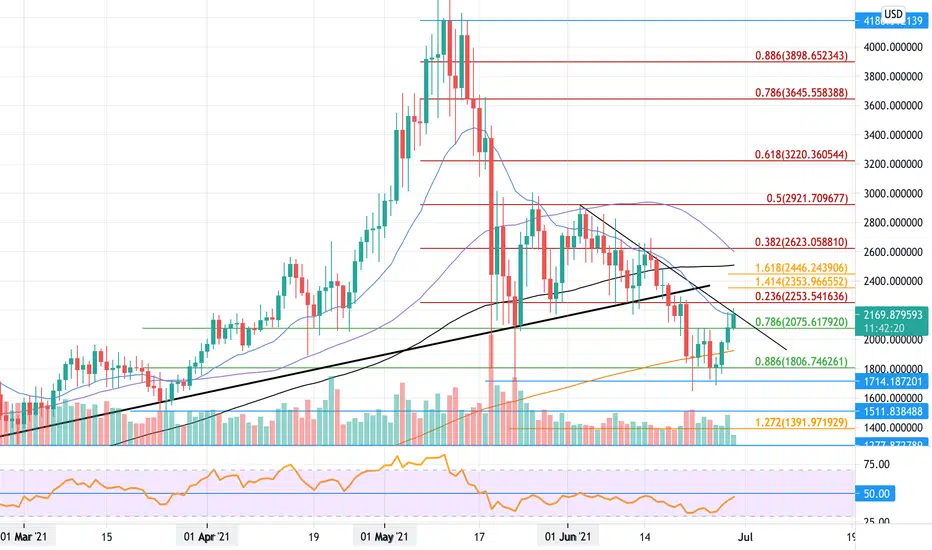
Taking a look at the daily chart above, we can clearly see that ETH has been trading beneath a falling trend line for the entire period of June. Nevertheless, over the weekend, the cryptocurrency managed to sustain the support around $1,800, provided by a .886 Fib Retracement level.
Since then, ETH has rebounded higher, and it managed to breach $2,000 yesterday. It has continued upward today and is now testing the falling trend line. A break above this trendline would end the June downtrend and could possibly give way to a recovery back toward the June highs around $2,920.
Ethereum price short term prediction: NEUTRAL
The break back above $2,000 has turned ETH neutral again. It is still a long way from turning bullish and would have to break the June highs at $2,921 to start to turn bullish in the short term. On the other side, a closing candle beneath $1,800 would be required to turn the market bearish again.
If the sellers push lower, the first support lies at $2,075 (.786 Fib Retracement). This level had supported the market during the May market capitulation. Beneath this, support lies at $2,000, $1,800 (.886 Fib Retracement), $1,715, and $1,600.
Where Is The Resistance Toward The Upside?
On the other side, if the buyers can break the falling trendline, the first resistance lies at $2,255 (bearish .236 Fib Retracement). This is followed by resistance at $2,353 (1.414 Fib Extension), $2,446 (1.618 Fib Extension), and $2,623 (bearish .382 Fib Retracement).
Additional resistance is then expected at $2,800, $2,921 (bearish .5 Fib Retracement), $3,000, and $3,220 (bearish .618 Fib Retracement).
Disclaimer
The information and publications are not meant to be, and do not constitute, financial, investment, trading, or other types of advice or recommendations supplied or endorsed by TradingView. Read more in the Terms of Use.
Disclaimer
The information and publications are not meant to be, and do not constitute, financial, investment, trading, or other types of advice or recommendations supplied or endorsed by TradingView. Read more in the Terms of Use.