Ethereum Macro Chart Breakdown – Eyeing $10K+ Targets!
Let’s zoom out and look at the bigger picture for ETH – this isn't just a pump; it’s a potential parabolic supercycle forming.
Technical Outlook:
Fractal Pattern Analysis
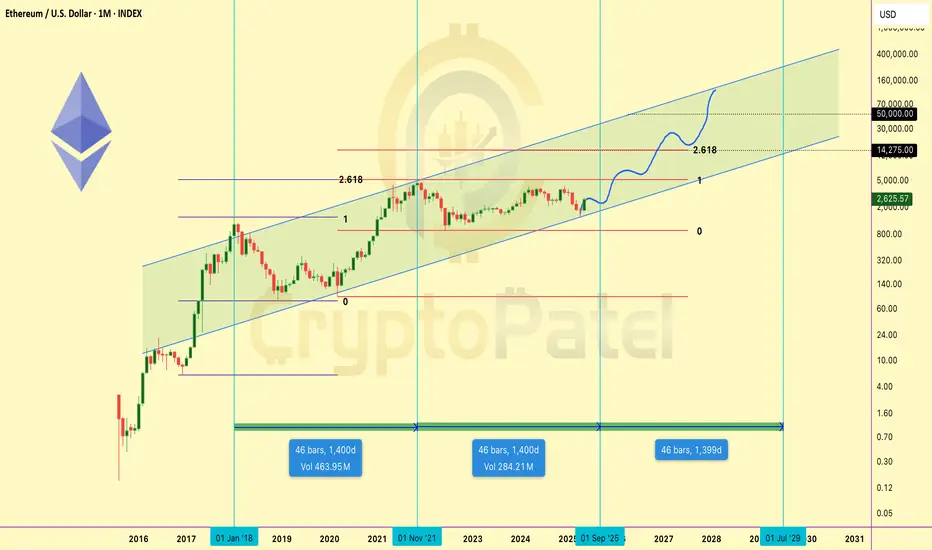
Ethereum is following a similar macro-structure to its 2017–2021 cycle, where after a long consolidation and accumulation phase, it exploded nearly 30x from bottom to top.
Current price action mirrors the post-2019 structure, and we’re at the same breakout stage right now.
Fibonacci Projections
Using the Fibonacci extension from the previous bear market low to the bull market top, and applying the same ratio from the 2022 bottom:
🔹 1.618 Fib = ~$10,000
🔹 2.618 Fib = ~$14,000
These targets align with Q4 2025–Q1 2026, based on previous cycle timings.
Structural Support
ETH is now trading above its 100-week EMA and holding bullish structure on higher timeframes. Previous resistance at $2,500 has flipped into strong support.
Momentum & Fundamentals
🔹 Layer 2 scaling is booming (Arbitrum, Base, zkSync)
🔹 Institutional ETH ETFs are launching
🔹 ETH powers Web3, DeFi, AI infra, RWAs, and more
🔹 Ultra-sound money supply dynamics + staking yield
🔹 Ecosystem growth is organic and robust
Projected Targets:
🎯 Short/Mid-Term (Q4 2025): $10,000 – $14,000
🚀 Ultra Long-Term (2029–2030): $40,000 – $50,000
If you still believe ETH is “just another altcoin,” you’re missing the bigger picture. Ethereum isn’t a meme — it’s the backbone of digital value, smart contracts, and future finance.
I’m long and accumulating ETH on dips. This isn’t just a trade — it’s a conviction play.
🗨️ Drop your ETH target in the comments 👇
🔁 Share this with someone sleeping on ETH!
Note: This is NFA So DYOR
Let’s zoom out and look at the bigger picture for
Technical Outlook:
Fractal Pattern Analysis
Ethereum is following a similar macro-structure to its 2017–2021 cycle, where after a long consolidation and accumulation phase, it exploded nearly 30x from bottom to top.
Current price action mirrors the post-2019 structure, and we’re at the same breakout stage right now.
Fibonacci Projections
Using the Fibonacci extension from the previous bear market low to the bull market top, and applying the same ratio from the 2022 bottom:
🔹 1.618 Fib = ~$10,000
🔹 2.618 Fib = ~$14,000
These targets align with Q4 2025–Q1 2026, based on previous cycle timings.
Structural Support
ETH is now trading above its 100-week EMA and holding bullish structure on higher timeframes. Previous resistance at $2,500 has flipped into strong support.
Momentum & Fundamentals
🔹 Layer 2 scaling is booming (Arbitrum, Base, zkSync)
🔹 Institutional ETH ETFs are launching
🔹 ETH powers Web3, DeFi, AI infra, RWAs, and more
🔹 Ultra-sound money supply dynamics + staking yield
🔹 Ecosystem growth is organic and robust
Projected Targets:
🎯 Short/Mid-Term (Q4 2025): $10,000 – $14,000
🚀 Ultra Long-Term (2029–2030): $40,000 – $50,000
If you still believe ETH is “just another altcoin,” you’re missing the bigger picture. Ethereum isn’t a meme — it’s the backbone of digital value, smart contracts, and future finance.
I’m long and accumulating ETH on dips. This isn’t just a trade — it’s a conviction play.
🗨️ Drop your ETH target in the comments 👇
🔁 Share this with someone sleeping on ETH!
Note: This is NFA So DYOR
Twitter: twitter.com/CryptoPatel
Telegram: t.me/OfficialCryptoPatel
Instagram: instagram.com/cryptopatel?utm_medium=copy_link
Telegram: t.me/OfficialCryptoPatel
Instagram: instagram.com/cryptopatel?utm_medium=copy_link
Disclaimer
The information and publications are not meant to be, and do not constitute, financial, investment, trading, or other types of advice or recommendations supplied or endorsed by TradingView. Read more in the Terms of Use.