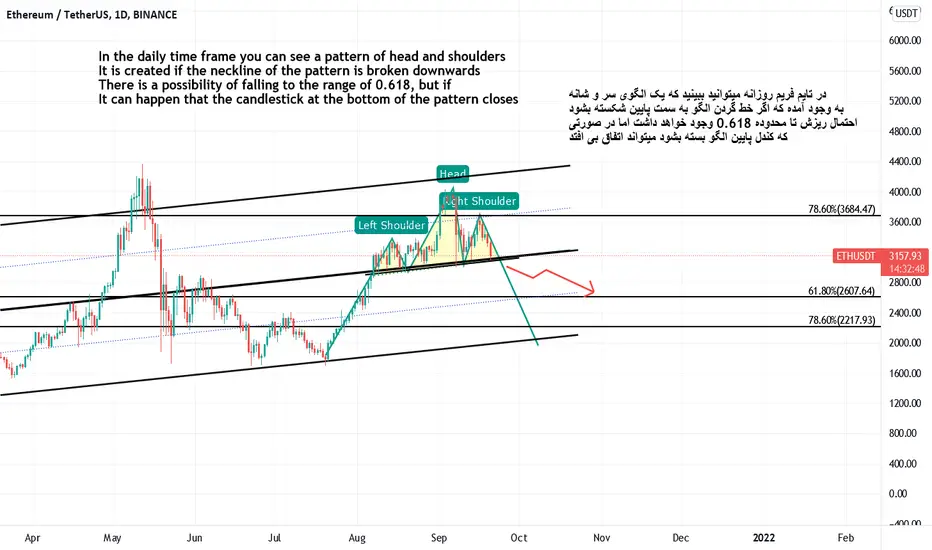
In the daily time frame you can see a pattern of head and shoulders
It is created if the neckline of the pattern is broken downwards
There is a possibility of falling to the range of 0.618, but if
It can happen that the candlestick at the bottom of the pattern closes
Disclaimer
The information and publications are not meant to be, and do not constitute, financial, investment, trading, or other types of advice or recommendations supplied or endorsed by TradingView. Read more in the Terms of Use.
Disclaimer
The information and publications are not meant to be, and do not constitute, financial, investment, trading, or other types of advice or recommendations supplied or endorsed by TradingView. Read more in the Terms of Use.