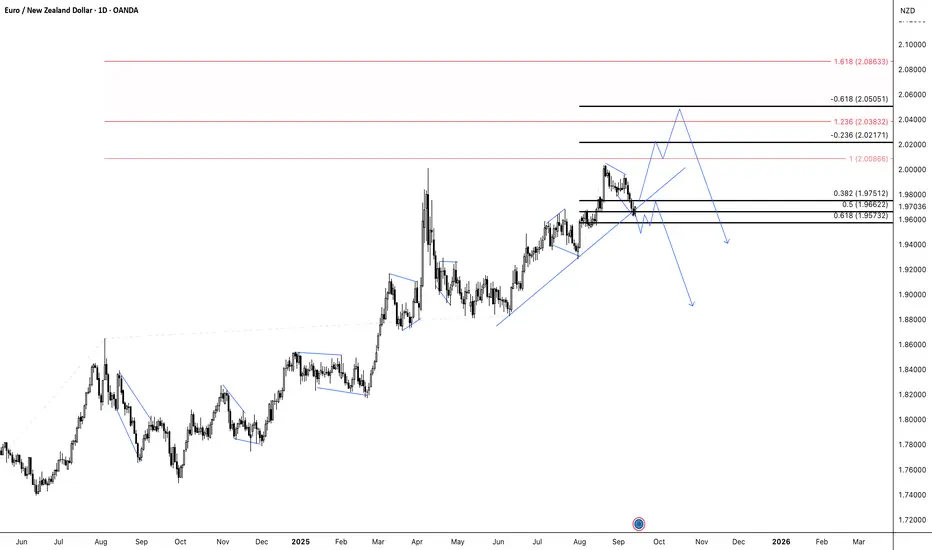
The structure on EURNZD suggests the pair is unfolding within a broader impulsive sequence, but the short-term leg appears corrective in nature. Price is currently reacting around the 1.96 – 1.97 zone, which aligns with a cluster of Fibonacci retracements.
From a wave perspective, the decline from recent highs looks corrective, hinting that another upward leg could still develop before the larger cycle turns lower.
If price holds above the 1.95 – 1.96 support region, an extension higher toward the 2.02 – 2.04 zone remains possible.
That zone coincides with Fibonacci projections and could serve as the completion area for the current upward phase.
Once that move matures, the broader structure points to a potential bearish transition, with deeper downside targets unfolding in line with the larger corrective path.
Wave analysis often reveals how markets expand in measured phases shorter-term corrections feeding into higher-degree swings. The key is to monitor whether price respects the current corrective floor or breaks it, which would confirm an earlier shift into the downward sequence.
👉 I’ll be looking for a sell setup if price reaches the 2.02 – 2.04 zone or if we break below the current trendline and consolidate.
⚠️ Disclaimer: This outlook is based on personal wave analysis and shared for educational purposes only. It is not financial advice. Trading involves risk—always do your own research before acting.
Disclaimer
The information and publications are not meant to be, and do not constitute, financial, investment, trading, or other types of advice or recommendations supplied or endorsed by TradingView. Read more in the Terms of Use.
Disclaimer
The information and publications are not meant to be, and do not constitute, financial, investment, trading, or other types of advice or recommendations supplied or endorsed by TradingView. Read more in the Terms of Use.