Sell Laurus Labs Futures, wave iii of new impulse completed
Laurus Labs one of the favourite stocks in pharma and for futures traders.
The stock has completed its wave iii of the new impulse with a sub-wave 5 extension at about 1.618 times of sub-wave 0-3 to 4 of wave iii.
The upside from here will be very limited.
Sell Laurus Labs. Since stock is of high value, trade with a stop loss of 840.
Will update target depending on type of correction as the wave progresses.
Happy Trading!!
Elliott Wave

PRINCEPIPE LONGThe Elliott Wave Theory's description of the structure and pattern of price movements in financial markets is known as the Elliott Wave Structure.
The Elliott Wave analysis indicates that the stock has completed waves (i) and (ii), which are shown as blue numbers on the daily chart. Journey of Wave (iii) is started.
It is anticipated that wave (iii) will have about five subdivisions shown in red color.
wave i (in red color) of wave (iii) will unfold in five sub waves shown in black circle.
Wave levels of wave i in red color is shown on chart.
I am not a registered Sebi analyst. My research is being done only for academic interests.
Please speak with your financial advisor before trading or making any investments. I take no responsibility whatsoever for your gains or losses.
Regards
Dr Vineet

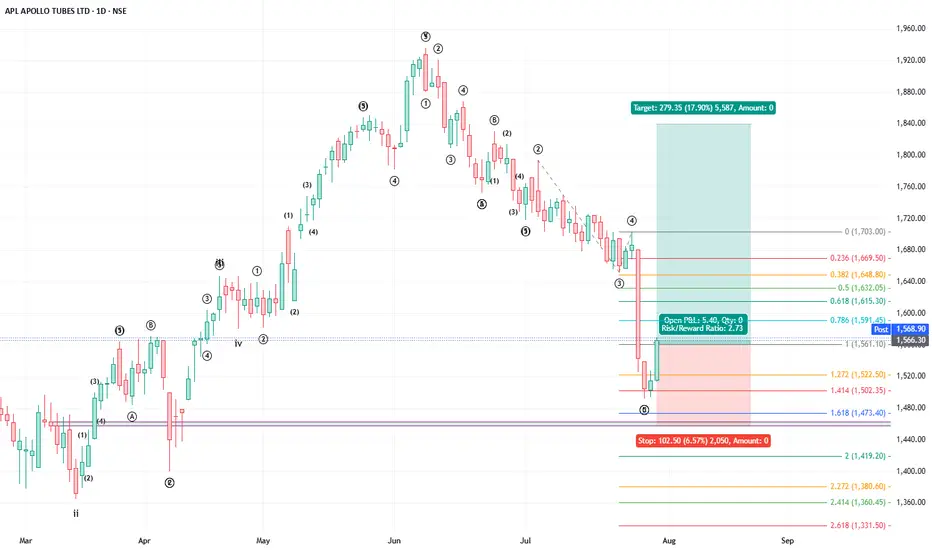
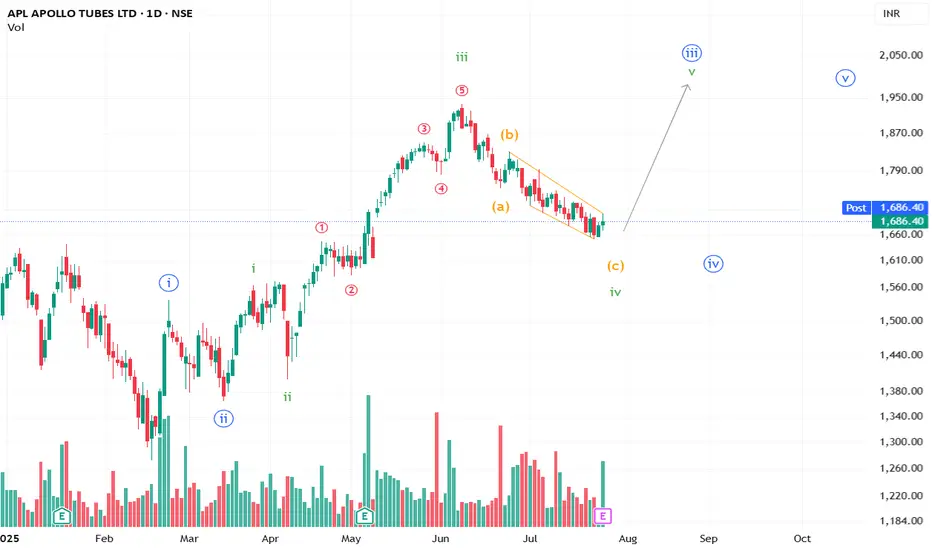
Buy Apollo TubesAPL Apollo Tubes has completed one full motive wave and related corrective wave in the form of a zigzag. All the wave markings are given in the chart.
One may consider going long on the stock with an initial target of 0.786 fibo retracement of the corrective wave. Stop loss is considered below 1.618 fibo retracement of Wave 2-3 to 4 of wave C of the corrective structure providing a risk-reward ratio of over 2.5x.
Will update the further targets as the stock waves unfold.
Happy Trading !!
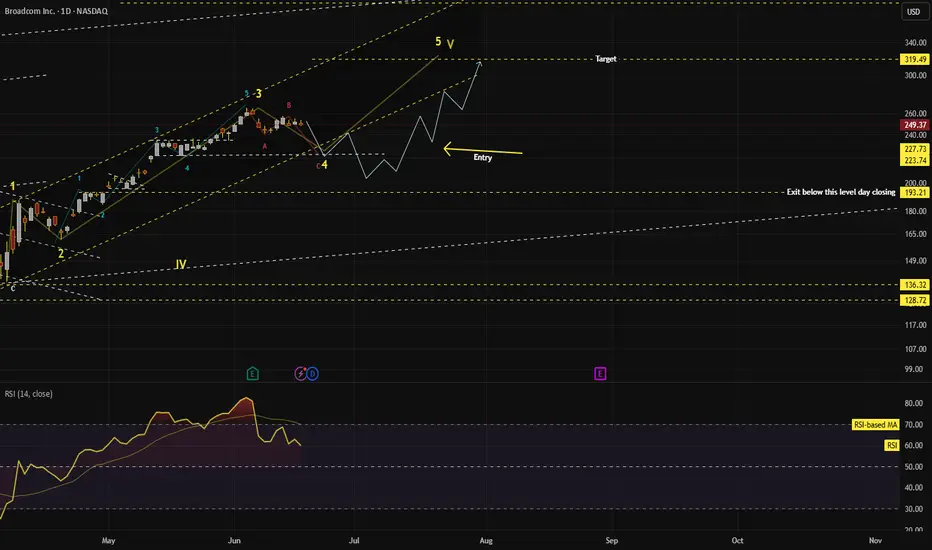
Broadcom (AVGO) can correct till 206, post that a target of 315 AVGO has completed its lower degree 5 waves and higher degree wave-3.
Currently it is correcting in ABC waves.
Blue line depicts probable path it may take correcting and then taking turn up towards a target of 315, which completes its higher degree Wave-5 and mostly larger Wave-5(Wave-V).
How can one enter ?
Wait for price to correct and make a entry pattern(as per Price action and RSI divergence)
Exit will be around 315 or any rule based system.
When this view will be negated:
If daily price closes below 193.25 above view gets negated.
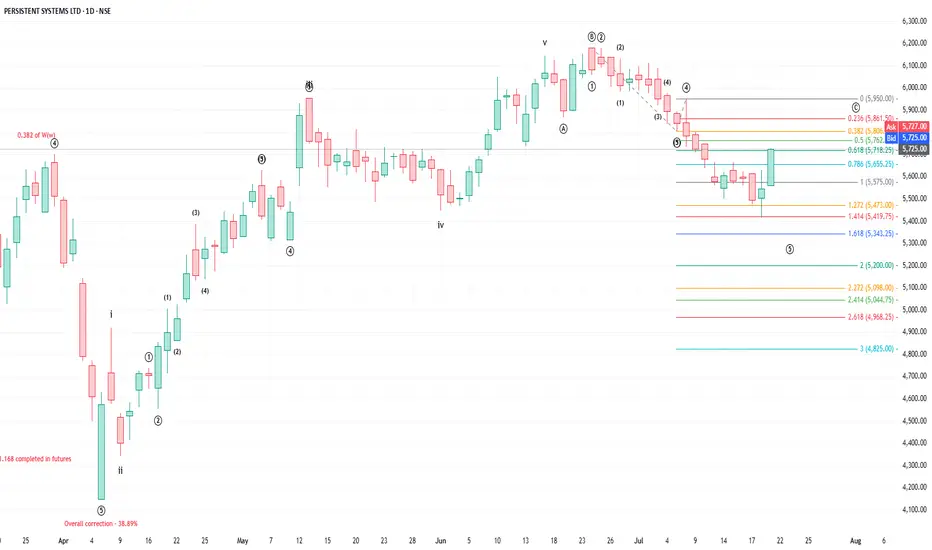
Buy Persistent system, target previous 6184
Persistent System completed larger degree wave 5 and underwent correction of about 40%. The stock completed the larger correction on 7 Apr 2025 and ever since has been forming a new impulse wave.
The stock completed the new impulse wave on 17June 2025 and has been undergoing correction in the form of a flat structure (3-3-5).
Wave C of the Flat (5-wave structure) had a 5th wave extension (as could be found in the wave markings). I was expecting stock to complete the 5th wave extension at 1.618, however stock took support at 1.414 and has started moving up. Stock is up already over 5% from July 18 lows.
One may consider going long when the stock corrects with a target of 6184.
Happy Trading.
SPANDANA LONGElliott Wave analysis shows that the stock has completed waves (i), (ii), (iii), (iv) and (v) downside. Currently, the stock is undergoing correction wave (a), (b), and (c) in a daily time frame.
Wave (a) and (b) in blue colour are finished and the stock is currently in wave (c).
Wave (a) unfolded in five sub waves in red colour and Wave (b) is folded in three sub waves (a-b-c) in red colour.
Wave (c) will unfold in five sub-waves shown in red colour on the chart.
Wave levels are shown on the chart.
Level of Invalidation
The starting point of Wave (a) has been identified as the invalidation level at 286.65. Because as per wave rules Wave (b) cannot retrace more than 100% of Wave (a). If the price falls below this level, it can indicate that the expected Elliott Wave pattern is not as it seems.
I am not a registered Sebi analyst. My research is being done only for academic interests.
Please speak with your financial advisor before trading or making any investments. I take no responsibility whatsoever for your gains or losses.
Regards
Dr Vineet

JBMA LONGThe Elliott Wave Theory's description of the structure and pattern of price movements in financial markets is known as the Elliott Wave Structure.
The Elliott Wave analysis indicates that the stock has completed waves (i),(ii),(iii) and (iv), which are shown as blue numbers on the daily chart. Wave (v) appears to be underway at this time.
Wave (v), also known as the impulse wave, unfolding into five waves, which are illustrated in red.
wave i and ii is finished and wave iii ( in red colour) will unfold in sub waves shown in black circle.
Black circle wave 1 and 2 is about to finish and wave 3 (in black circle) will start.
Wave levels are depicted on the chart.
Level of Invalidation
The invalidation level of 1388 has been identified as the start point of wave i of wave (v). If the price falls below this level, it means that the projected Elliott Wave pattern is not as it appears.
I'm not a registered Sebi analyst. My research is done solely for academic purposes.
Please consult your financial advisor before trading or investing. I bear no responsibility for your profits or losses.
Regards,
Dr Vineet

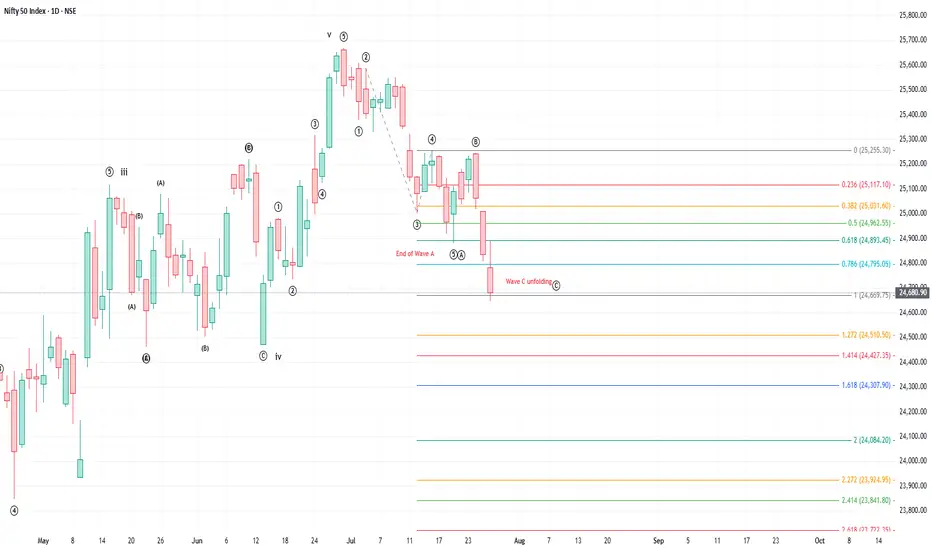
Decoding Nifty’s Correction: What Lies Ahead?Is Nifty poised for a deeper correction? And if so, why? Let’s look at it through the lens of Elliott Wave Theory.
Elliott Wave distinguishes between motive waves, which unfold in 5-wave structures, and corrective waves, which unfold in 3-wave patterns. Within a 5-wave move, waves 2 and 4 act as counter-trend corrections. In a 3-wave correction, wave B typically moves against the prevailing trend.
Corrective patterns can take the form of flats, zigzags, or triangles, each with its own character. There are rules for their formation. Interestingly, in bullish market, corrections often behave like a runaway bride in waves 2 and 4 —where they defy clean textbook expectations.
Now, after every 5-wave advance, a correction typically follows. The depth of this correction depends on whether the preceding 5-wave structure was part of a smaller swing or the completion of a larger trend.
So, what’s happening with Nifty?
It appears that Nifty has completed a FULL 5-wave advance. The correction from 15 May to 13 June is a flat correction as posted earlier, which followed the end of wave (iii). (I’ll post why it is end of wave (iii) in the comments section.
The next swing up (13 June to 30 June) also unfolded as a clear 5-wave move. If the correction is attributable only to this swing, then it will not go lower than the lower extreme of the swing.
If this upward leg marks end of wave 5 of a larger structure , then what we’re seeing now is a proper 3-wave corrective structure which will bring a decent retracement to the entire up move.
Typically, end points of larger moves can be validated using Fibonacci ratios—like comparing wave 0–3 to 4, or wave 2–3 to 4. In this case, no clear Fibonacci relationship appears, but that sometimes happens.
Now, here's the tricky part: corrective waves are the hardest to decode in Elliott Wave analysis. Markets often react to multiple retracement levels, making early predictions risky unless at least one leg of the correction is fully formed.
Looking at recent action:
The decline from 30 June to 21 July looks like a clean 5-wave down, suggesting a potential wave A. The bounce that followed fits well as a 3-wave move, likely wave B.
And now, Nifty seems to be forming wave C, unfolding rapidly with gap-downs and accelerated moves—a sign that the correction is still in play.
I’ll share more thoughts soon on Wave C as it unfolds in the comments section.
Buy Infosys, stop loss 1546Infosys completed its major correction on 7 April after correcting about 35%. The stock has been forming a new impulse wave ever since.
As given in the charts, the new impulse wave had a iii-wave extension and completed wave iii on 12 May and has been undergoing correction.
Rationale :
As marked in the charts, the structure represents a flat corrective structure under Elliot wave theory which is a 3-3-5 structure. Wave A (divides into three waves), wave B (divides into three waves) and wave C divides into 5-waves. The minimum requirement for wave A to Wave B ratio is >1 (for normal flat).
As given in the chart, the corrective structure complies with all above conditions. Wave C has a 5-wave structure, sub-wave three has an extension (i.e. it has its own 5 waves). At Wave 2-3 to 4 ratio of 0.5 stocked bounced up and in the process completing the minimum requirement of Wave A to Wave B ratio of >1. Given this there is a good possibility for stock to proceed upwards.
Buy with a stop loss of 1546, TP will be updated as waves unfold.

FLAIR LONGThe Elliott Wave analysis indicates that the stock has finished waves (i) and (ii).
Stock is moving in the wave (iii), which are shown by blue numbers on the daily chart.
Wave (iii), also known as the strongest impulse wave, unfolded into five waves, which are illustrated in red.
waves i, ii, iii and iv are finished and shown in red colour on the chart.
Wave v (in red colour) of wave (iii) (in blue colour) will unfold in five waves, as illustrated in the black circle.
Wave levels are depicted on the chart.
Level of Invalidation
The invalidation level of 294 has been identified as the end point for wave i. If the price falls below this level, it means that the projected Elliott Wave pattern is not as it appears.
I'm not a registered Sebi analyst. My research is done solely for academic purposes.
Please consult your financial advisor before trading or investing. I bear no responsibility for your profits or losses.
Regards,
Dr Vineet

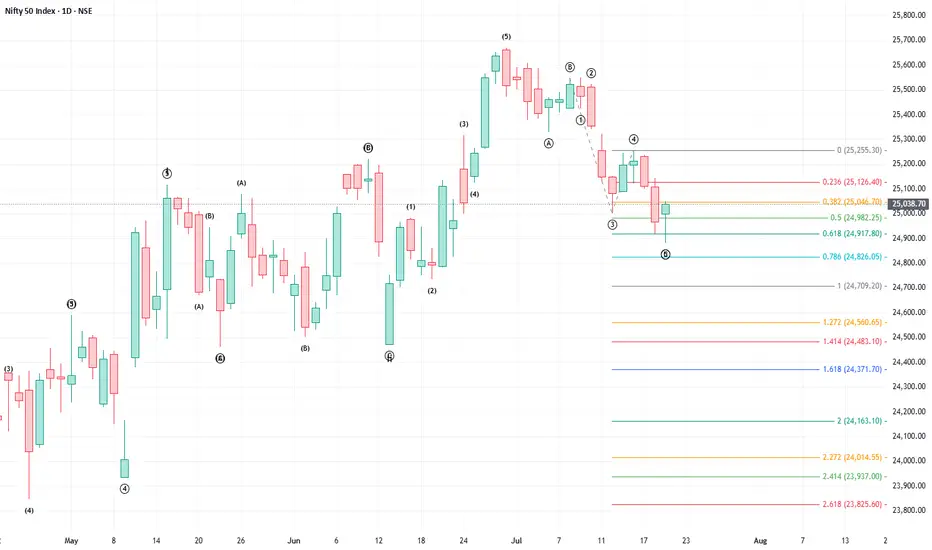
Go long on Nifty
Refer to my earlier publication on Nifty Trajectory wherein I had mentioned that Nifty is undergoing a correction in the form of a Flat and had correctly predicted that wave C got completed at little over 1 x of Wave A and that one may consider going long on Nifty (May - June consolidation).
Further to this, Nifty completed its first order impulse wave on 1 July and has been undergoing correction in the form of a zigzag. Wave C in all probability is complete at 0.618 fibo extention of wave 0-3 to 4 as given in the charts.
One may consider long position on Nifty with stop loss below today's low.
IDFCFIRSTB LONGElliott Wave analysis shows that the stock has completed wave i in black circle. Currently, the stock is undergoing correction wave ii shown in black circle. wave (ii) will move in (a), (b), and (c) in a daily time frame in blue color.
Wave (a) in blue colour is completed and the stock is currently in wave (b).
Wave (b) will unfold in three sub-waves (a-b-c) shown in red colour on the chart.
Wave a and b (red colour) of wave (b) is completed and the stock is in wave c of wave (b).
Wave level is shown on the chart.
Level of Invalidation
The starting point of Wave c has been identified as the invalidation level at 62.40. If the price falls below this level, it can indicate that the expected Elliott Wave pattern is not as it seems.
I am not a registered Sebi analyst. My research is being done only for academic interests.
Please speak with your financial advisor before trading or making any investments. I take no responsibility whatsoever for your gains or losses.
Regards
Dr Vineet

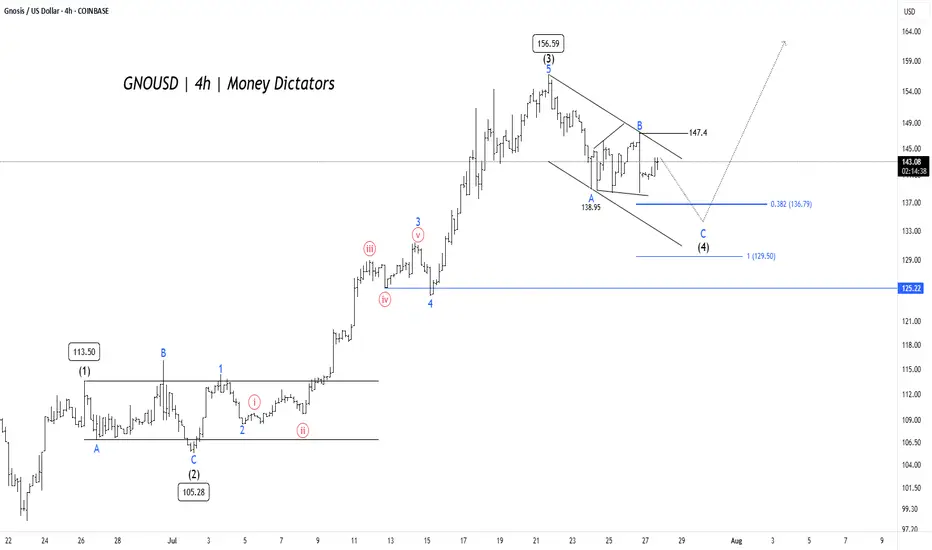
GNO/USD Price Action Aligns for Final Wave 5 PushGNO/USD pair is unfolding a clean Elliott Wave impulse pattern on the 4-hour chart. The rally began with Wave (1) reaching 113.50, followed by a corrective Wave (2) that bottomed near 105.28. This set the stage for a powerful Wave (3) that surged to 156.59 , aligning well with Elliott Wave theory where Wave 3 is typically the strongest and steepest leg in the sequence.
Wave (4) is now in progress, taking the form of an A-B-C correction inside a descending channel. Interim support was found at 138.95 during Wave A, and Wave C could extend toward the 0.382 Fibonacci retracement level at 136.79 or the deeper support zone near 129.5. These levels are crucial, as they often mark the end of a corrective phase and the beginning of the next impulse. A confirmed breakout above 147.4 would signal the start of Wave (5) and the return of bullish momentum.
Short-term targets have the potential to reach 135 – 128 , while 125.22 remains the invalidation level for this bullish setup. After the completion of Wave (4), traders can look for long opportunities targeting 147 – 154 – 172 . As long as the structure holds and price respects key supports, the outlook remains favorable for a fresh push higher in Wave (5).
Tough Times ahead for Nifty. 26277 Top for some years?Nifty has been in Bull run for some Years now.
2008 to 2020 - Wave 1 Impulse
2020 Crash - Wave 2 Correction
2020 to 2025 - Wave 3 Impulse
2025 to 2026 - Wave 4 Correction
2026 2027 Onwards - Wave 5 Impulse
Let's Break Wave 4
It may take place in Double or Triple wave Combo.
The Corrective Wave ends in 3 or more Legs.
Wave A - 26k to 22k.
Wave B - 22k to 25.5k
Wave C - 25.5k to 21k
Next Set of Legs - to Follow in New idea.
This would be the 1st of the Corrective Combo that is expected to end around 19k By 2026 2027.
Now could be the Time for Wave C with rejection from 0.854 of Fib retracement of Wave A.
It looks like Wave C is about to begin.. Let's meet at 21k 🫣
RSI - Circled - to be noted.
All The Best🥲
Short Trade Activates below 24750.

APL Apollo Tubes Limited Set to Surge?A well-formed ABC correction to the downside appears to be losing steam, and an upward move may take shape.
**This is an educational market outlook, not investment advice. Please consult a SEBI-registered advisor before taking any investment decisions.**
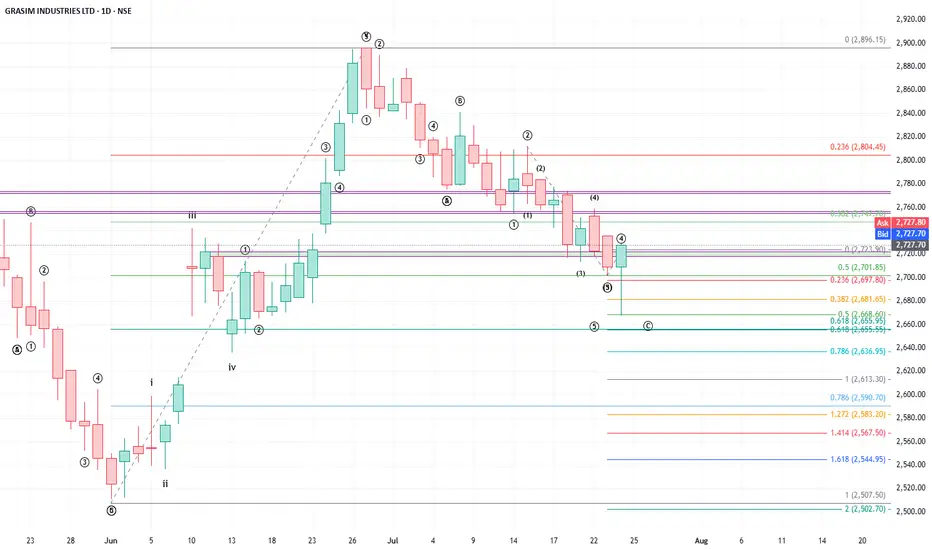
Buy Grasim
Further to my earlier buy call on Grasim given on 30 May, the stock delivered a return of over 15%. The stock completed its next impulse wave and has been undergoing correction since 27 June.
The correction happened in the form of a zigzag which is a 5-3-5 structure. All the wave markings are given in the chart.
The stock in all likelihood has completed correction at 0.5 fibo extension of wave 2-3 to 4 of wave as given shown in the chart.
Buy with a stop loss of 2647.
Target the last high and higher targets will be updated as the wave unfolds.
Happy Trading !!

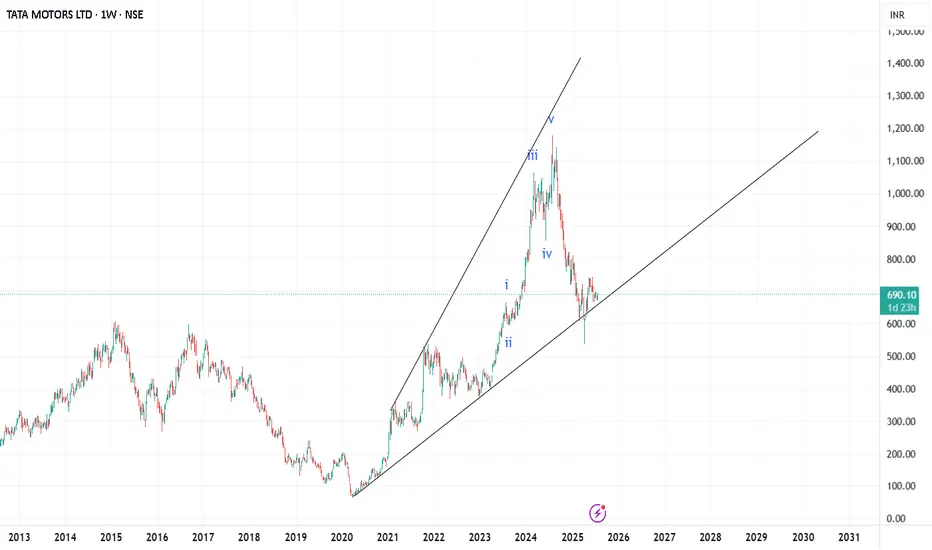
Weekly- End of correctionOn arithmetic scale it looks like a wave 5 extended . But on log scale it is a wave 3 . We have to be pragmatic in order to make money . So if we see a clear-cut wave which is there in this case we need to buy with a sl of wave 4. If wave 4 breaks next SL would be bottom of wave 2 . See the dark green candle there. Correction is over .
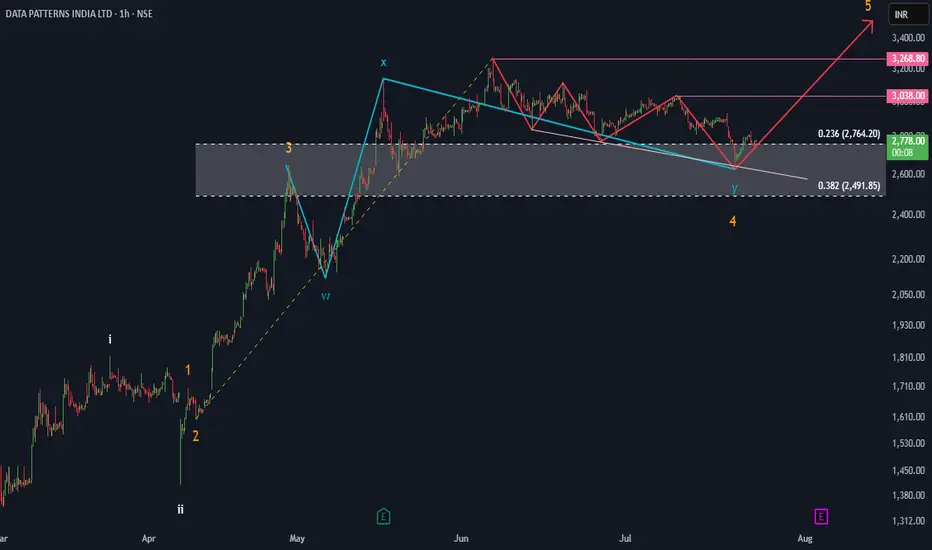
Impulse underway.Stock seems to be moving in an impulsive manner.We can see fractal nature of the price over here as a larger degree impulse's wave 3 has been sub divided in another 5 wave,of which it seems like we are done with 4 waves,and 5th of 3rd has jut commenced.going ahead we can see decent up move in the stock price from current market price of 2778.
once can go long at 2778 with a stop-loss of 2626 on the downside and a target of 3038-3200 giving us a risk reward of atleast 1:2.
Disclaimer :This are just my views on the stock and elliot wave analysis presented is just for my future reference.No position should solely be taken on the basis of this analysis.
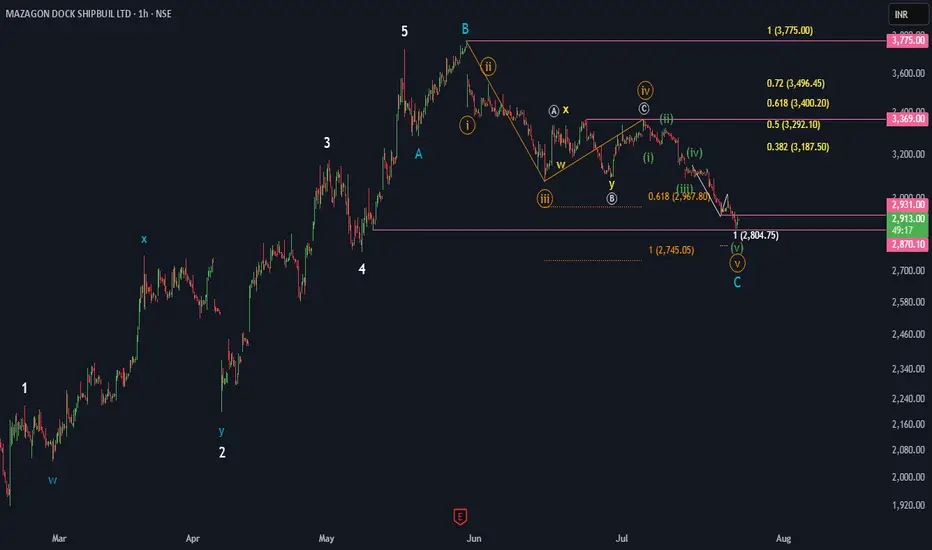
ABC irregular correction nearing a completionOverview:
Prices are making higher high and higher low indicating stock trading in an up trend,here as per Elliot wave theory price is currently unfolding an corrective pattern post and 5 wave 5 impulse which mean post this correction we can expect another impulsive 5 wave move on the upside.
Analysis:
As shown in white color an impulsive 5 wave move got completed at the high of 3775,post which we are seeing an ABC correction marked in BLUE color,this ABC turned out to be an irregular type wherein wave B crossed wave A high,post which we are seeing an impulsive decline marked in mustard color.This wave C impulse's wave 5 is already extended,hence going forward we can we can quick recovery once price crosses 2931 level.
Verdict:
If we get a hourly close above 2931 then one can go long with a stop-loss of 2740 and a target of 3187,3292,3400,3496.
Disclaimer:There is no guarantee of profits or no exceptions from losses. The study provided is solely the personal views of my research. You are advised to rely on your judgment while investing/Trading decisions. Past performance is not an indicator of future returns. Investment is subject to market risks. Seek help of your financial advisors before investing/trading.
I may or may not trade this analysis
EUR/USD Elliott Wave Update –Classic Wave 5 Breakout Opportunity
This chart of the EUR/USD pair shows a well-structured Elliott Wave impulse pattern unfolding on the 4-hour timeframe. The price action is currently progressing in the final Wave (5) of the impulse cycle, which typically represents the last bullish leg before a larger correction begins.
Wave (1): The initial move up from the bottom (early May), showing a clean 5-wave internal structure.
Wave (2): A healthy retracement after Wave 1, forming a base for further upside.
Wave (3): The strongest and steepest rally, as expected in Elliott theory. It broke past previous highs and extended sharply.
Wave (4): A corrective phase that formed a falling wedge pattern — typically a bullish continuation pattern.
Wave (5): Currently in progress. The wedge has broken to the upside, confirming the potential start of Wave 5.
Target 1 (T1): 1.18306
Target 2 (T2): 1.19012
Stop Loss (SL): 1.16600
After a strong uptrend, the market went sideways in a wedge pattern (a typical wave 4 behavior). It has now broken out, signaling the start of the final wave 5 move. This is often a strong and sharp push. Since the breakout is clean and the Elliott wave count aligns well, this creates a favorable long opportunity.

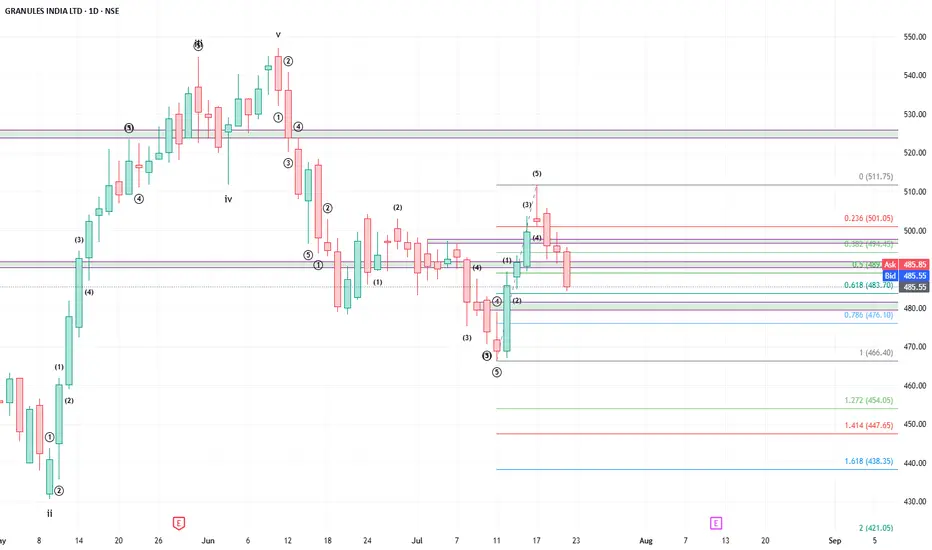
Buy Granules at 483/476 levels, target 545
Granules had completed corrective wave structure of the previous impulse in the form of a zigzag as given in the chart and has since been forming new impulse wave.
Stock has completed wave 1 of lower degree and has been correcting providing a buying opportunity. Stock may take support at 0.618 to 0.786 levels.
Buy in the range of 483 / 476 levels for a target price of 545 or higher. Maintain stop loss of 472
Will revise the targets as the impulse wave continues.
Happy Trading!!
A Bullish Continuation Wedge + Elliott WaveIn NSE:ZENTEC the upward movement is likely to resume.
PLEASE NOTE THAT:
This chart analysis is only for reference purpose.
This is not buying or selling recommendations.
I am not SEBI registered.
Please consult your financial advisor before taking any trade

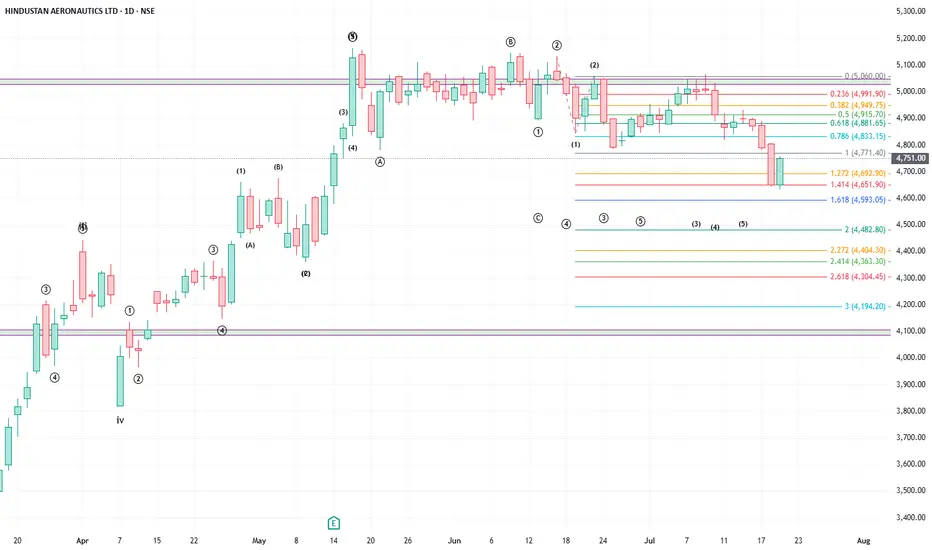
What Is Consolidation? How Can Wave Theory Help You Trade it?
Let’s take HAL as a live example to understand a concept many traders struggle with — "Consolidation".
HAL has been moving sideways ("consolidation") since May 19 and gave a downward breakout on June 24. Yesterday, it formed a strong green candle, which left many traders wondering:
“Is this a buying opportunity or a sell-on-rise setup?”
The conflicting signals during consolidation are exactly what make it confusing. But Elliott Wave Theory can bring clarity.
Wave Perspective: Not Just Sideways — It is a "Flat Correction"
The current price action resembles a Flat corrective structure, one of the three classic Elliott corrective patterns (the others being Zigzag and Triangle). A Flat follows a 3-3-5 structure:
Wave A: Three waves down (corrective)
Wave B: Three waves up (can go above the start of A)
Wave C: Five-wave impulse down — sometimes with an extended wave (i.e. one of the waves shall have 5-sub waves).
Until Wave C fully unfolds, the correction is not complete. Any upside move in between is likely to be a counter-trend wave, not the start of a new trend.
So, What Is Consolidation?
From a wave perspective, consolidation is not random. It’s a structural necessity — the market is completing a complex correction before the next impulsive leg begins.
In strong stocks like HAL, you’ll often see:
A temporary bounce from Fibonacci extension levels which leads to price re-entering Wave 1 territory, which would invalidate an impulse but still fits a corrective structure. A new wave count has to happen again which prolongs the impulse formation. A prolonged sideways to downward move, not because of indecision, but because Wave C hasn’t finished.
How This Helps You Make Better Trading Decisions
The recent green candle may seem bullish, but if it's part of Wave C, it’s just a counter-wave bounce. Elliott Wave structure warns against early entries during such bounces. It suggests a more informed approach: “Sell on rise” until the full correction plays out
Key Takeaway
Consolidation isn’t noise — it’s structure.
When you understand the wave context, you stop guessing and start anticipating.
What’s your view? Are you trading this move or waiting for Wave C to complete? Leave your comments.