### **Technical Analysis of Federal Bank Ltd. (NSE)**
The **cup and handle** formations on **Federal Bank Ltd.'s** chart signal potential bullish momentum.
### **Key Observations:**
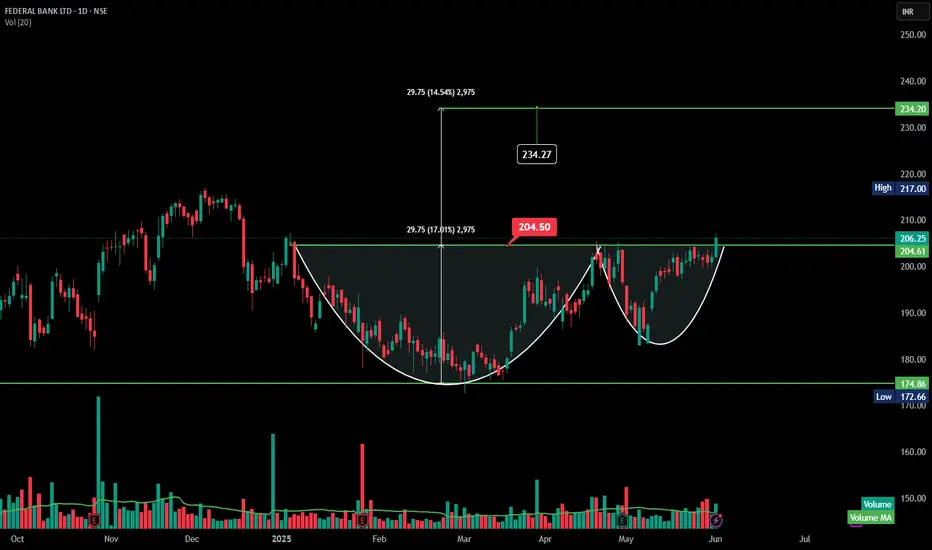
1. **Cup and Handle Patterns:**
- **First Formation:** A breakout suggests a potential move toward **234.27 INR** (+14.54%).
2. **Breakout Confirmation:**
- **Current Price:** **206.25 INR**, up **2.07% (+4.19 INR)**.
- **Resistance Level:** **217.00 INR**—break above this could accelerate gains.
- **Support Level:** 205 neckline
3. **Volume Trends:**
- **12.79M vs. 8.24M (Avg.)**—above average trading volume strengthens breakout validity.
The **cup and handle** formations on **Federal Bank Ltd.'s** chart signal potential bullish momentum.
### **Key Observations:**
1. **Cup and Handle Patterns:**
- **First Formation:** A breakout suggests a potential move toward **234.27 INR** (+14.54%).
2. **Breakout Confirmation:**
- **Current Price:** **206.25 INR**, up **2.07% (+4.19 INR)**.
- **Resistance Level:** **217.00 INR**—break above this could accelerate gains.
- **Support Level:** 205 neckline
3. **Volume Trends:**
- **12.79M vs. 8.24M (Avg.)**—above average trading volume strengthens breakout validity.
Disclaimer
The information and publications are not meant to be, and do not constitute, financial, investment, trading, or other types of advice or recommendations supplied or endorsed by TradingView. Read more in the Terms of Use.
Disclaimer
The information and publications are not meant to be, and do not constitute, financial, investment, trading, or other types of advice or recommendations supplied or endorsed by TradingView. Read more in the Terms of Use.