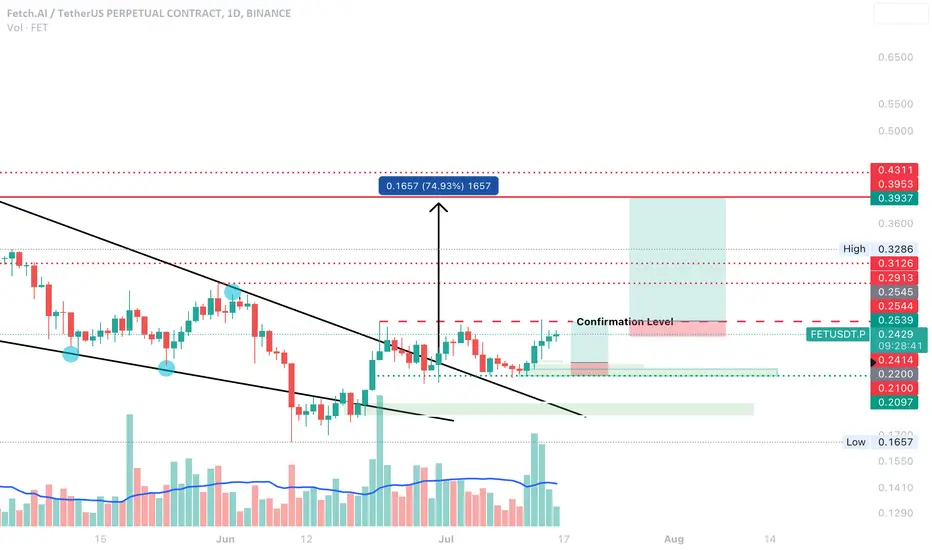
• Since it broke out of the Descending Wedge, FET is ranging between 0.21 – 0.255 USD.
• Considering that the TOTAL3 chart indicates a bullish breakout, my bias remains bullish.
• On July 14th, FET hit the upper boundary of a 1H demand zone and bounced. Until a confirmed break out of the range high, a return to the range lows is still likely.
• I am posting two short-term trade ideas. However, my mid-term target for FET is 0.395 USD based on the breakout target from the Descending Wedge.
Trade Idea No. 1:
• Entry: 0.22 (4H demand zone)
• SL: 0.21
• Target: 0.254
• R: R: 1:3.4
Trade Idea No. 2:
• Entry: 0.2547 (range breakout after retesting as support)
• SL: 0.2415 (Range low).
• Target: 0.395
• R: R: 1:10.6
Related publications
Disclaimer
The information and publications are not meant to be, and do not constitute, financial, investment, trading, or other types of advice or recommendations supplied or endorsed by TradingView. Read more in the Terms of Use.
Related publications
Disclaimer
The information and publications are not meant to be, and do not constitute, financial, investment, trading, or other types of advice or recommendations supplied or endorsed by TradingView. Read more in the Terms of Use.